Corona Virus and Inequality, Essay Example
Abstract
Although current studies have investigated the Corona Virus from a theoretical vantage point, they have overlooked the underlying variables causing the issue, which requires econometrics. This empirical research aims to evaluate the hypothesis that Coronavirus is increasing income inequality in the US. It derives econometric models such as the IS-LM curve from viewing the pandemic’s macroeconomic effects and discusses the results. The results are crucial as they will contribute to the existing research and raises questions for future studies. By using an empirical approach, this examination will address this gap by analyzing the causal econometric factors and their impact on income inequality.
Introduction
The Coronavirus pandemic has affected all spheres of human life by changing most countries’ social and economic states. In the United States (US), our area of focus, the epidemic’s economic impacts are rampant. Interestingly, those who seem to be most impacted are minorities. Although the virus has affected all of us, it does seem to have different impacts across socioeconomic ladders when considering national wealth inequality. (Buckley and Barua 2). The interest of this paper is analyzing how the Coronavirus has exacerbated income inequality, and the primary tool used to prove this is the investment-savings and liquidity preference-money supply model (IS-LM) model.
Overview of Wealth Inequality and Coronavirus in the United States
Overall, COVID-19 has affected minority groups such as Africans and Hispanics more than their Caucasian counterparts. A reason for this is that minorities disproportionally suffer from pre-existing health effects compared to white wealthier families. Diseases such as heart disease, obesity, and diabetes are more prevalent amongst minorities, heightening the risk of the virus (Buckler and Barua 2). Combined with a high prevalence of poverty and lower private health insurance levels, it becomes clear why there are different impacts based on socioeconomics. Hispanics’ poverty rate is recorded at 17.6%, while for Black Americans is 20.8%. These percentages are higher when compared to non-Hispanic whites, which is at 8.1% (Berchick et al. Table 5). Additionally, non-Hispanic whites have more private health insurance policies than African Americans and Hispanics (Berchick et al. Table 5).
Another essential reason COVID -19 has exacerbated income equality is the differences in occupation levels among racial groups. Hispanics and Blacks have more low-paying careers than non-Hispanic whites as a whole (Bucker and Barua 2). The COVID-19 shutdowns have affected such jobs more than the high-end ones (Buckler and Barua 2). These issues lead to an increase in income inequality. The primary reason is that those in the higher income bracket will retain their jobs and continue receiving their salaries, increasing their wealth as individuals in the lower-income bracket remain jobless during the pandemic.
History of US Income Inequality
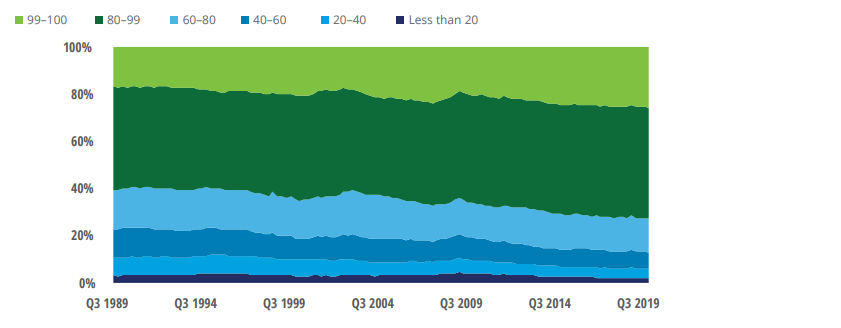
Figure 1. Percentage of household income as compared to their total net worth (FRB, 2020)
The inequality of wealth and income distribution in the US is apparent when viewing this graph. In the past three decades, the amount of total national wealth held by the top 10% of high-income homes has increased from 60.8% to 70% (FRB, 2020). The wealth possessed by the top 1% of individuals earning the highest incomes has risen from 17.2 to 26 %, which is a quarter of national wealth (Figure 1) (FRB, 2020). As this trend continues, primarily through the neoclassical policies that pushed for deregulating markets set by the past administration, we will see inequality increase. Inequality is evident as most of the wealth is in the hands of few people, while minorities continue to suffer the short end of the stick.
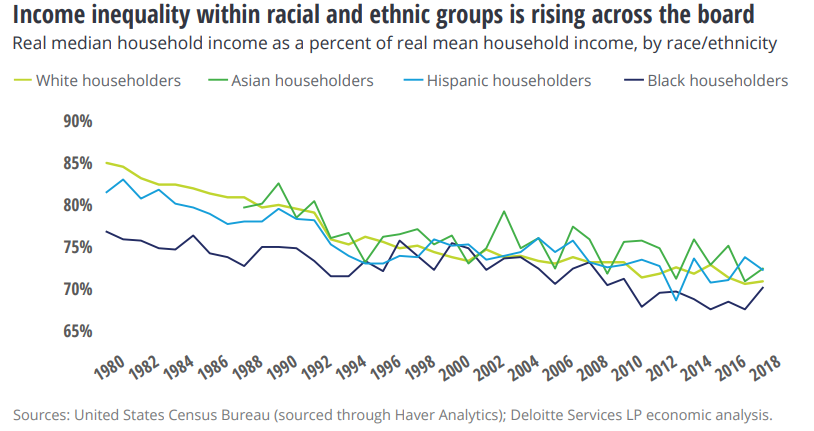
Figure 2. Graph showing income inequality rising across all races utilizing the cumulative median household income as a proportion of the overall mean household income (FRB. 2020).
As much as there is inequality among different racial profiles, it still exists within the same groups. From the graph, there is a decrease in the percentage of real median household income when related to the cumulative mean household income in all the indicated races (figure 2) (FRB, 2020). For instance, non-Hispanic whites face wealth inequality among their communities. The real mean household income is increasing faster than the median, evidence of rising inequality (FRB, 2020). Non-Hispanic whites, Asians, Hispanics, and African Americans in the US face the same challenge, which widens the overall wealth gap. A significant contributing factor is the differences in occupations. Compared to high-income groups, Low-wage income earners have less combined wealth than high salaried individuals. Owing to a higher population of low-income earners, it cements wealth distribution as a challenge to both the federal government and the state.
Recessions and Income Inequality
Observably, the relationship between recessions and income inequality is inverse as the gap between the rich and poor increases. For instance, during 2007-2010, the median income for African American families fell by 10%, a more dramatic fall than the white and Hispanic (USCB). Similarly, in the 2001-2002 recessions, African American income dropped by 3%, while for the whites, the income decrease was 0.3% (Bucker and Barua 5). Economic recovery mechanisms through fiscal and monetary policy can be helpful, but it usually increases whites’ median income more than the African Americans. These instances indicate how the present pandemic contributes to wealth distribution inequality as the minorities’ income continuously decreases.
Moreover, the deteriorating labor market is attributing to inequality. Employment rates among African Americans fell more during the 2007-2010 recessions than Asians and whites. It dropped by 5.9% as compared to 4.1% for Asians (BLS). The issues are reflected in the 2001-2000 recessions were that African Americans lost more jobs than non-Hispanic whites and Asians. In the current pandemic, Hispanics and Africans have the highest unemployment rates. These instances present the relationship between recessions and the minority groups, which is critical in understanding income inequality in the current pandemic.
The Impact of Recession in Low-Income Earners worsens Inequality
Stepping outside the racial perspective, it is noteworthy to infer that lower-income groups are affected more than high-income individuals during an economic crisis. In this case, low-wage earners have an income that is 200% below the federal poverty level, and they receive an annual income of $25,861, while the high-end households’ yearly income is approximately $145,500 (NPC, 2006; Bennett et al., 2020). These figures include all racial profiles in the country. Drawing from the 2007-2009 recession, citizens at the lowest occupation level had an unemployment rate of 4.5%, while the high-income 0.6% (BLS). This trend also appeared in the 2001-2002 recession. Presently, it is the lowly salaried individuals that are suffering from the pandemic. From February to May 2020, the unemployment rate was 19.8% as compared to 3.6% for high-salaried jobs, according to the US Bureau of Labor Statistics.
The disparity between high- and low-income earners fuels inequality exacerbates during recessions. This COVID-19 pandemic has brought similar effects to the economy. For example, in the Asian labor market, 36% of the low-wage individual lost their job, while employment among the high-income earners increased by 0.5% (UCSB). This instance explains why low-income struggle more during a recession. (Buckley and Barua 7).
Understanding Inequality with the IS-LM Model
In deriving the IS-LM model, there are two assumptions about the variables in the equations. First, the distribution of income is presumed to be log-normal. Secondly, there is a presumption that the coefficient representing a variation of income is exogenous. In this case, the latter is used to measure inequality in the economy (Calvert 3). This value is pertinent for this study, as it enables individuals to compare the state of inequality before Coronavirus and the Present.
Importance of IS Curve in Measuring Inequality
IS Curve Equation: ln (E [Y]) = (ln M/ ? ? ln c/ ?)? + (? ln r)/ ? + (1 ? ?)0.5 ln (CV [Y] 2 + 1) (Calvert 4)
If income inequality increases by ?<1, the IS curves shifts out in (E[Y]), r) space, while if the increase is by ?>1, the IS curve shifts in the region. However, when ?=1, there are no changes in the curve movement. The marginal propensity for saving increases on income when ?>1 (Keynes 101). Here, the variation coefficient of income increases and shifts income to individuals with a higher marginal propensity to save (Rothschild and Stiglitz 70). This action makes the curve shift in instead of outwards. As such, when there is an increase in income inequality, individuals in the higher income bracket save more and increase their investments.
Deriving the IS Curve and its Implications
In the quest to decrypt the IS curve for inequality determination, Calvert utilizes the following three assumptions to guide the process (Calvert 3).
Assumption 1. (A1). There is the log-normal distribution of individual income: Y ? ln N (µ, ?2)
Assumption 2(A2). Individual income’s log-linear function is individual saving: S = aY?
Assumption 3(A3). Interest rates are a log-linear function of per capita investment. I= br?? (Calvert 3)
Drawing from the first two assumptions (A1 and A2), the coefficient representing the income variation and the expected income can be obtained. Also, derivation of the log-normal distribution of individual savings and the expected savings is critical to creating a right-skewed graph as there is the assumption that the growth factor’s distribution is normal (Calvert 3).
To derive the IS curve, the expected saving needs to be equated to per capita investment (Calvert 3). In the quest to find the solution to the curve, the variation coefficient is regarded as exogenous. Hence, the expressions derived at the assumptions’ level will be applicable in this section (Calvert 3).
Deriving the LM Curve and its Impacts on Income Inequality
In this section, there is the addition of two assumptions to formulate the curve:
Assumption 4(A4). The log-linear function of interest rate and people’s income is individual money demand. Md = cY ? r ??
Assumption 5 (A5). Money supply per capita is continuous. Ms = M. (Calvert 4)
Drawing from A1 in the IS curve and A4, equations for log-normal distribution for individual money demand and expected demand can be developed (Calvert 4). Afterward, the LM curve’s formulation is by equalizing the projected demand for money to its supply per capita. Here, the goods market equilibrium equation is concomitant to the money market equilibrium in this case (Calvert 4). It is possible to derive the LM curve using the same principle. Therefore, rearranging the derived equations while utilizing µ and ? 2 from the coefficient representing income variation will give the possible equation for the LM curve, which is reshuffle to be more precise.
LM curve equation; ln (E [Y]) = (ln M/ ? ? ln c/ ?)? + (1 ? ?)0.5 ln (CV [Y] 2 (? ln r)/ ? + 1)(Calvert 4)
The LM curve moves out in (E[Y], r) region if there is a surge of income inequality by ? < 1, while it shifts inside if the increase is by 1>?. If the increase is equal to ?, then the curve maintains its position (Calvert 4). A rise in the coefficient representing a variation of income means earnings moves to those who have lower liquidity preference, making the LM curve shift outside.
Developing the IS-LM Model at Equilibrium
Combining equation 4 and 2 results in the development of IS-LM curves:
y= L3 + L4i + (1 ? ?) f(C)………. (LM)
y= S1 ? Si + (1 ? ?) f(C)…………(IS) (Calvert 5)
Unless there is the presentation of extra information of ? and ?, the IS and LM shift resulting from inequality is unknown. There is evidence that supports when ?<1 and ? > 1, the IS curve will move towards the left, while the LM curve will move outwards (Carvalho and Rezai 5). The marginal propensity to save money upsurges while the liquidity preference reduces (Tily 187). As a result, consumption will reduce while investment increases, which is a catalyst for income inequality in the IS-LM presentation since the investments are majorly from the higher income individuals (figure 3)
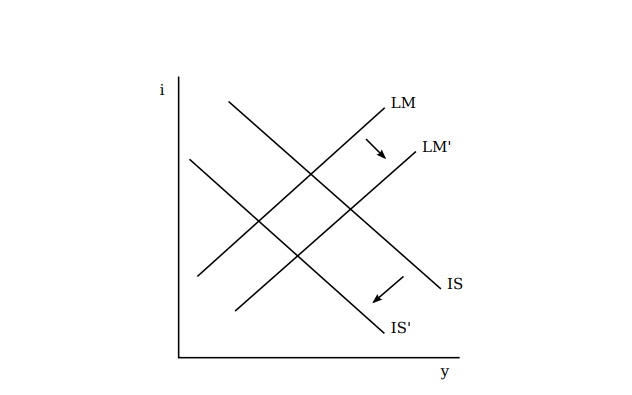
Figure 3. A rise in income inequality effect in the IS-LM curve (Calvert 6)
Nevertheless, the resultant impact of these shifts on income per capita is not clear. It relies on the values of ? and ?. Besides the two entities, it depends on elasticities of income in their reduced form with respect to interest. On interest rates, a surge in inequality will reduce its value.
Relevant Data relating to this study
As the study focuses on Coronavirus’s impact on income inequality, the variables identified have to be concurrent with the topic. The hypothesis expects that income inequality will surge owing to the pandemic. From the derived IS-LM model, when there is an increase in the inequitable distribution of income, consumption of goods and services will decrease, and investments will increase. Besides, an increase in inequality leads to a decrease in interest rates (Calvert 5). Here, the values provided through a comparative approach will enable an individual to comprehend COVID-19 effects.
Analysis
US Investments and Consumption Rate
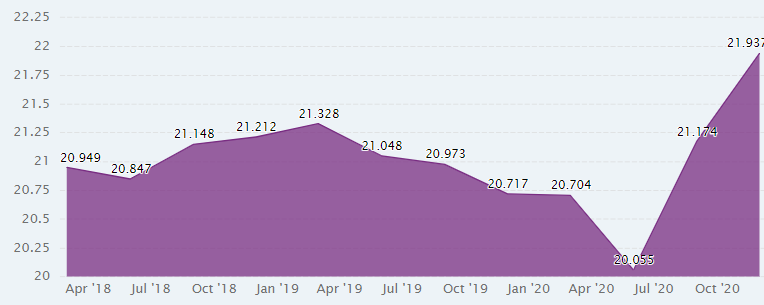
Figure 4. Graph showing US investment as a percentage of GDP (CEIC)
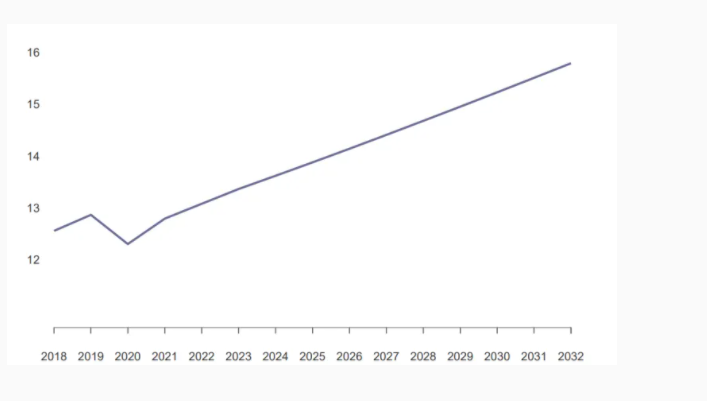
Figure 5. Graph showing total US personal consumption expenditures from 2018-2032.
Drawing from figure 4, it is clear that the investment rate increased in December 2020 compared to the previous quarter (CEIC). The investments grew by 0.7%, despite the Coronavirus pandemic. The total US consumption expenditure dropped from approximately $13 trillion to $12 trillion in 2020, as shown in figure 5(Mitterling et al.). The IS-LM model indicates an increase in investment with a decrease in consumer expenditure implies a rise in income inequality. This result is in line with the hypothesis, as shown in figure 3.
Interest Rates
The US lowered its interest rates from 1.5% to 0% in 2020 (Cheng et al.). This reduction is to enable the economy to recover and encourage exports (Tily 227). Drawing from the IS-LM model in this study, a decrease in interest rates increases wealth inequality. A drop in interest rates makes the stock market favorable for high-net-worth individuals as they have a large portion of the loanable funds market. This group is more likely to have a propensity to own more assets, which will increase the wealth owned by 1% of the population.
Summary
This study has delved deeper into the subject of inequality relating to Coronavirus using the IS-LM model. Before establishing the effects, it presented a brief recap of how recessions can affect an economy. Afterward, it introduces the concept of IS-LM by analyzing its constituents and their relation to income inequality. This action enables an individual to understand the final derivation of the IS-LM model. The variables in the curve reveal the impacts of an increase in income inequality in the economy. From the inferences, it is clear that lower interests increase income inequality. Besides, investments will increase as consumption rates decrease in similar conditions. This empirical conclusion is proven by the United States 2020 data on the same.
Conclusion
COVID-19 has disrupted the economy, as observed in the global supply chains and financial markets’ performance. The US is one of the countries experiencing the severity of the pandemic. It has increased the wealth gap among the US populace. As such, the high-income individuals occupy most of the nation’s wealth. The IS-LM curve exposes this trend through its variables. In the US, investments are on the rise, while there is a reduction in personal consumption expenditure. Besides, COVID-19 has forced the government to lower its interest rates. All these factors are indicators of a surge in income inequality in an economy, as revealed by the IS-LM model. These results imply that Coronavirus affects wealth distribution in the economy. Nevertheless, the research has explored only a few variables concerning investment, consumption, and interest rates. It, therefore, calls for more studies regarding wage setting and endogenous growth models.
Works Cited
Bennett, J., Fry, R., & Kochhar, R. (2020, July 30). Are you in the American middle class? Find out with our income calculator. Pew Research Center. https://www.pewresearch.org/fact-tank/2020/07/23/are-you-in-the-american-middle-class/.
Berchick, Edward R, et al. “Health Insurance in the United States: 2018- Tables” (Table 5). United States Census Bureau, 10 Sept. 2019, www.census.gov/data/tables/2019/demo/health-insurance/p60-267.html.
Buckler, Patricia, and Akrur Barua. “COVID-19’s Impact on US Income Inequality”. Www2.Deloitte.Com, https://www2.deloitte.com/content/dam/insights/us/articles/6786_IbtN-COVID-19-and-inequality/DI_IbtN-COVID-19-and-inequality.pdf. Accessed 28 Feb 2021.
Calvert Jump, Robert. “Inequality and Aggregate Demand in the IS?LM and IS?MP Models.” Bulletin of Economic Research 70.3 (2018): 1-8.
Carvalho, Laura, and Armon Rezai. “Personal income inequality and aggregate demand.” Cambridge Journal of Economics 40.2 (2016): 1-15.
CEIC. “US Investment: % of GDP.” Census and Economic Information Center, www.ceicdata.com/en/indicator/united-states/investment–nominal-gdp#:~:text=United%20States%20Investment%3A%20%25%20of%20GDP,-1947%20%2D%202020%20%7C%20Quarterly&text=United%20States%20Investment%20accounted%20for,21.2%20%25%20in%20the%20previous%20quarter.&text=CEIC%20calculates%20Investment%20as%20%25%20of,Formation%20and%20quarterly%20Nominal%20GDP.
Cheng, Jeffrey, et al. “What’s the Fed Doing in Response to the COVID-19 Crisis? What More Could It Do?” Brookings, Brookings, 8 Feb. 2021, www.brookings.edu/research/fed-response-to-covid19/.
Federal Reserve Board. (2020). Distributional Financial Accounts(CSV file). Federal Reserve. https://www.federalreserve.gov/releases/z1/dataviz/dfa/index.html#:~:text=The%20Distributional%20Financial%20Accounts%20(DFAs,through%20the%20most%20recent%20quarter.
Keynes, John Maynard. The general theory of employment, interest, and money. Springer, 2018.
Mitterling, Thomas, et al. “The Decline and Recovery of Consumer Spending in the US.” Brookings, Brookings, 14 Dec. 2020, www.brookings.edu/blog/future-development/2020/12/14/the-decline-and-recovery-of-consumer-spending-in-the-us/#:~:text=In%202020%2C%20American%20residents%20will,trillion%20less%20than%20last%20year.
National Poverty Center (NPC)(2006). An Assessment of the Income and Expenses of America’s Low-Income Families Using Survey Data from the National Survey of America’s Families. National Poverty Centre. http://www.npc.umich.edu/publications/u/working_paper06-37.pdf.
Rothschild, Michael, and Joseph E. Stiglitz. “Increasing risk II: Its economic consequences.” Journal of Economic theory 3.1 (1971): 66-84.
Roy, Debasish. “IS-LM model revisited in the perspective of underground economy.” Journal of Money Laundering Control (2017).
Tily, Geoff. Keynes’s General Theory, the Rate of Interest and Keynesian economics. Springer, 2016.
United States Bureau of Labor Statistics (BLS), “Monthly Household Data.” https://www.bls.gov/cps/tables.htm
United States Census Bureau (USCB), “Current Population Survey Tables for Household Income” (Table HINC-4), https://www.census.gov/data/tables/time-series/demo/income-poverty/cps-hinc.html

Time is precious
don’t waste it!

Plagiarism-free
guarantee

Privacy
guarantee

Secure
checkout

Money back
guarantee


