 All papers examples
Disciplines

- MLA
- APA
- Master's
- Undergraduate
- High School
- PhD
- Harvard
- Biology
- Art
- Drama
- Movies
- Theatre
- Painting
- Music
- Architecture
- Dance
- Design
- History
- American History
- Asian History
- Literature
- Antique Literature
- American Literature
- Asian Literature
- Classic English Literature
- World Literature
- Creative Writing
- English
- Linguistics
- Law
- Criminal Justice
- Legal Issues
- Ethics
- Philosophy
- Religion
- Theology
- Anthropology
- Archaeology
- Economics
- Tourism
- Political Science
- World Affairs
- Psychology
- Sociology
- African-American Studies
- East European Studies
- Latin-American Studies
- Native-American Studies
- West European Studies
- Family and Consumer Science
- Social Issues
- Women and Gender Studies
- Social Work
- Natural Sciences
- Anatomy
- Zoology
- Ecology
- Chemistry
- Pharmacology
- Earth science
- Geography
- Geology
- Astronomy
- Physics
- Agriculture
- Agricultural Studies
- Computer Science
- Internet
- IT Management
- Web Design
- Mathematics
- Business
- Accounting
- Finance
- Investments
- Logistics
- Trade
- Management
- Marketing
- Engineering and Technology
- Engineering
- Technology
- Aeronautics
- Aviation
- Medicine and Health
- Alternative Medicine
- Healthcare
- Nursing
- Nutrition
- Communications and Media
- Advertising
- Communication Strategies
- Journalism
- Public Relations
- Education
- Educational Theories
- Pedagogy
- Teacher's Career
- Statistics
- Chicago/Turabian
- Nature
- Company Analysis
- Sport
- Paintings
- E-commerce
- Holocaust
- Education Theories
- Fashion
- Shakespeare
- Canadian Studies
- Science
- Food Safety
- Relation of Global Warming and Extreme Weather Condition
Paper Types

- Movie Review
- Essay
- Admission Essay
- Annotated Bibliography
- Application Essay
- Article Critique
- Article Review
- Article Writing
- Assessment
- Book Review
- Business Plan
- Business Proposal
- Capstone Project
- Case Study
- Coursework
- Cover Letter
- Creative Essay
- Dissertation
- Dissertation - Abstract
- Dissertation - Conclusion
- Dissertation - Discussion
- Dissertation - Hypothesis
- Dissertation - Introduction
- Dissertation - Literature
- Dissertation - Methodology
- Dissertation - Results
- GCSE Coursework
- Grant Proposal
- Admission Essay
- Annotated Bibliography
- Application Essay
- Article
- Article Critique
- Article Review
- Article Writing
- Assessment
- Book Review
- Business Plan
- Business Proposal
- Capstone Project
- Case Study
- Coursework
- Cover Letter
- Creative Essay
- Dissertation
- Dissertation - Abstract
- Dissertation - Conclusion
- Dissertation - Discussion
- Dissertation - Hypothesis
- Dissertation - Introduction
- Dissertation - Literature
- Dissertation - Methodology
- Dissertation - Results
- Essay
- GCSE Coursework
- Grant Proposal
- Interview
- Lab Report
- Literature Review
- Marketing Plan
- Math Problem
- Movie Analysis
- Movie Review
- Multiple Choice Quiz
- Online Quiz
- Outline
- Personal Statement
- Poem
- Power Point Presentation
- Power Point Presentation With Speaker Notes
- Questionnaire
- Quiz
- Reaction Paper
- Research Paper
- Research Proposal
- Resume
- Speech
- Statistics problem
- SWOT analysis
- Term Paper
- Thesis Paper
- Accounting
- Advertising
- Aeronautics
- African-American Studies
- Agricultural Studies
- Agriculture
- Alternative Medicine
- American History
- American Literature
- Anatomy
- Anthropology
- Antique Literature
- APA
- Archaeology
- Architecture
- Art
- Asian History
- Asian Literature
- Astronomy
- Aviation
- Biology
- Business
- Canadian Studies
- Chemistry
- Chicago/Turabian
- Classic English Literature
- Communication Strategies
- Communications and Media
- Company Analysis
- Computer Science
- Creative Writing
- Criminal Justice
- Dance
- Design
- Drama
- E-commerce
- Earth science
- East European Studies
- Ecology
- Economics
- Education
- Education Theories
- Educational Theories
- Engineering
- Engineering and Technology
- English
- Ethics
- Family and Consumer Science
- Fashion
- Finance
- Food Safety
- Geography
- Geology
- Harvard
- Healthcare
- High School
- History
- Holocaust
- Internet
- Investments
- IT Management
- Journalism
- Latin-American Studies
- Law
- Legal Issues
- Linguistics
- Literature
- Logistics
- Management
- Marketing
- Master's
- Mathematics
- Medicine and Health
- MLA
- Movies
- Music
- Native-American Studies
- Natural Sciences
- Nature
- Nursing
- Nutrition
- Painting
- Paintings
- Pedagogy
- Pharmacology
- PhD
- Philosophy
- Physics
- Political Science
- Psychology
- Public Relations
- Relation of Global Warming and Extreme Weather Condition
- Religion
- Science
- Shakespeare
- Social Issues
- Social Work
- Sociology
- Sport
- Statistics
- Teacher's Career
- Technology
- Theatre
- Theology
- Tourism
- Trade
- Undergraduate
- Web Design
- West European Studies
- Women and Gender Studies
- World Affairs
- World Literature
- Zoology
Dying, Death, and Bereavement, Essay Example
Hire a Writer for Custom Essay
Use 10% Off Discount: "custom10" in 1 Click 👇
You are free to use it as an inspiration or a source for your own work.


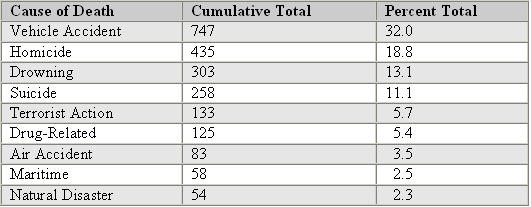
The first table shows the numbers in deaths and their causes. There are nine different categories for the causes of death as listed in the table, the top being of vehicle accidents. The numbers seem legitimate if you look at them at a glance, the cumulative total of people who have passed were counted and also their percentage as a whole was divided. By simply looking at the numbers and the statistics, you can say that it seems very believable that, for example 435 people died through homicide and this accounts for 18% of the deaths. It provides information saying that the data the tables have are the ones collected from the years 2004-2007.
The statistics however are missing a few pieces. It begs to ask the question of where these numbers came from. The table does not state which country this information is relevant to, and one cannot quickly generalize that these statistics are true in all cases. Also, there are a number of things missing in the table such as other causes of death. There are a few types of death which I can think of from the top of my head such as cancer or any other chronic illness. Not listing all the possibilities of death makes the information on this graph come off as a fallacy, because there is no direct comparison of information and data. Therefore, there is no way of really accurately measuring the statistics.
This may be corrected by adding the other causes of death, maybe even into a category entitled “other”. These trends seem like just numbers, and there is nothing about the table or statistics that gives other information. According to Alter and Carmichael (1996) it is difficult to pinpoint the exact trends of death because of certain changing situations. For this information to be more accurate, the table must be separated in to four different tables from different years.

The second table shows the top six countries who have the highest numbers in unnatural deaths. The first on the list is Mexico with a cumulative total of 635 people and a percentage of 28. The data provides a number of countries which were included in the statistics, yet only information and date on the top six countries are available.
The table is missing a number of things such as cause of death, and exactly when this study was conducted. Non-natural deaths can be caused by a number of things, and for the table to be accurate; these things need to be clarified. If a cause of death is more focused on than another, it should be stated on the table’s heading, for example “Top Six Countries and their total number of non-natural death – suicide”. The table is far too general. Also, it has to be established what a natural death is, in order for the non-natural deaths to be defined. In the 20st Century, the top cause of non-natural death was famine and starvation, this was not at all mentioned in the table above, and leaves me wondering whether it was taken in to account in the causes of non-natural death (Aiken, 2001).

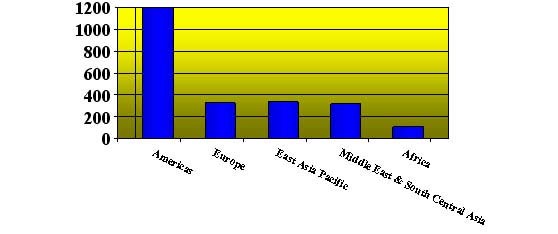
The graph showing the number of non-natural deaths by region states that the data is from the period 2004 – 2007. It shows the Americas accounting for 53% of non-natural deaths abroad. The other regions are Europe, East Asia Pacific, the Middle East and South Central Asia, and Africa.
Again, the table does not state what the causes of death were, and how they are defined to be unnatural. It shows a graph with the numbers of people who have died from non-natural causes, yet does not accurately point out the percentages or reasons of death. A study shows that alcohol accounts for 47% of the deaths in the United States (Sjogren, Eriksson & Ahlm, 2000). This information was not given in the table above, suggesting that it is not something which was put in to considerations when analyzing total numbers of death.
For the graph to be more accurate, it might help if the study was divided in to more specific dates. This can isolate what years the deaths occurred in, and can tell us something more about the trends in deaths. By doing this, it would help with the analysis of why the deaths were occurring by looking in to certain events which may have triggered them in the years. If the deaths were to do with terrorism, they should be written in a way where it is compared to whatever it is they believe are terrorist actions.

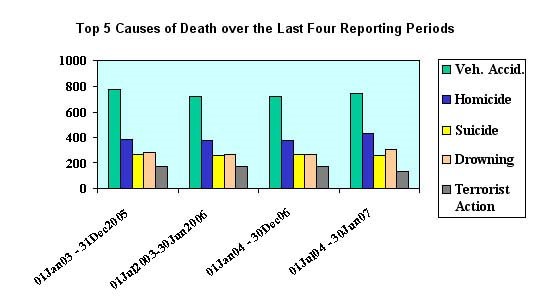
The second graph shows the top five causes of death over the last four reporting periods. These are namely: vehicle accidents, homicide, suicide, drowning and terrorist action. The rates for vehicle accidents remain stable and at a high over the last four periods, this was followed by homicide which remained at around the same level. Terrorist action seemed to die down throughout the years, but not dramatically. However, the rates of suicide and drowning interchange throughout time.
The information on this graph does seem very reliable. It splits the time periods well, and shows trends during the years. However, the graph does not take in to account the deaths which were of a mixed sort, such as a homicide death by drowning. It is not very specific on their definitions of the terms and remains very general for readers to assume what the numbers mean. According to Fazey (2007) drug trafficking have direct connections with terrorist attacks and homicide. Therefore, the category of drug related deaths should be included, and the definition for this made broader.

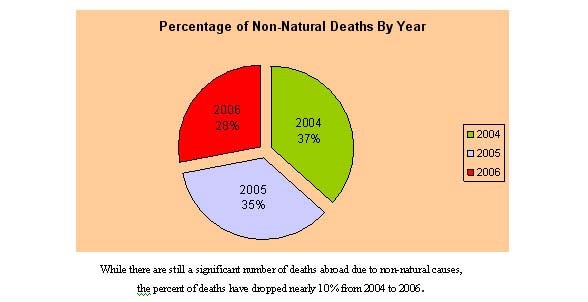
The pie chart which shows the percentage of non-natural deaths organized by year leaves a lot to question. It is divided in to three parts, 2004, 2005 and 2006. The chart gives one piece of information saying that the percent of deaths have dropped nearly 10% from the year 2004 to 2006. It does not specify what kind of non-natural death it is speaking about.
If the information was made clearer, and the definition of a non-natural death was defined, the statistics and data on the graph would be more useful. The graph also should have information on what are this data is pertaining to, and maybe even what age range the deaths are occurring at. This very little information given makes the graph and the data useless, and the information presented comes off as a fallacy since anyone can be free to assume what they want the data to mean.
References
Aiken, L.R. (2001). Dying, Death, and Bereavement, 4th ed., Mahwah, NJ: Lawrence Erlbaum Associates. pp. 7.
Alter, G., & Carmichael, A. (1996). Studying Causes of Death in the Past Problems and Models. Historical Method,. 29(2); 44.
Fazey, C. (2007). International Policy on Illicit Drug Trafficking: the Formal and Informal Mechanisms. Journal of Drug Issues. 37(4); 755.
Sjogren, H., Eriksson, A., &, Ahlm, K. (2000). Alcohol and Unnatural Deaths in Sweden: A Medico-Legal Autopsy Study. Journal of Studies on Alcohol, 61(4); 507.

Stuck with your Essay?
Get in touch with one of our experts for instant help!
Tags:

Time is precious
don’t waste it!
writing help!


Plagiarism-free
guarantee

Privacy
guarantee

Secure
checkout

Money back
guarantee

