 All papers examples
Disciplines

- MLA
- APA
- Master's
- Undergraduate
- High School
- PhD
- Harvard
- Biology
- Art
- Drama
- Movies
- Theatre
- Painting
- Music
- Architecture
- Dance
- Design
- History
- American History
- Asian History
- Literature
- Antique Literature
- American Literature
- Asian Literature
- Classic English Literature
- World Literature
- Creative Writing
- English
- Linguistics
- Law
- Criminal Justice
- Legal Issues
- Ethics
- Philosophy
- Religion
- Theology
- Anthropology
- Archaeology
- Economics
- Tourism
- Political Science
- World Affairs
- Psychology
- Sociology
- African-American Studies
- East European Studies
- Latin-American Studies
- Native-American Studies
- West European Studies
- Family and Consumer Science
- Social Issues
- Women and Gender Studies
- Social Work
- Natural Sciences
- Anatomy
- Zoology
- Ecology
- Chemistry
- Pharmacology
- Earth science
- Geography
- Geology
- Astronomy
- Physics
- Agriculture
- Agricultural Studies
- Computer Science
- Internet
- IT Management
- Web Design
- Mathematics
- Business
- Accounting
- Finance
- Investments
- Logistics
- Trade
- Management
- Marketing
- Engineering and Technology
- Engineering
- Technology
- Aeronautics
- Aviation
- Medicine and Health
- Alternative Medicine
- Healthcare
- Nursing
- Nutrition
- Communications and Media
- Advertising
- Communication Strategies
- Journalism
- Public Relations
- Education
- Educational Theories
- Pedagogy
- Teacher's Career
- Statistics
- Chicago/Turabian
- Nature
- Company Analysis
- Sport
- Paintings
- E-commerce
- Holocaust
- Education Theories
- Fashion
- Shakespeare
- Canadian Studies
- Science
- Food Safety
- Relation of Global Warming and Extreme Weather Condition
Paper Types

- Movie Review
- Essay
- Admission Essay
- Annotated Bibliography
- Application Essay
- Article Critique
- Article Review
- Article Writing
- Assessment
- Book Review
- Business Plan
- Business Proposal
- Capstone Project
- Case Study
- Coursework
- Cover Letter
- Creative Essay
- Dissertation
- Dissertation - Abstract
- Dissertation - Conclusion
- Dissertation - Discussion
- Dissertation - Hypothesis
- Dissertation - Introduction
- Dissertation - Literature
- Dissertation - Methodology
- Dissertation - Results
- GCSE Coursework
- Grant Proposal
- Admission Essay
- Annotated Bibliography
- Application Essay
- Article
- Article Critique
- Article Review
- Article Writing
- Assessment
- Book Review
- Business Plan
- Business Proposal
- Capstone Project
- Case Study
- Coursework
- Cover Letter
- Creative Essay
- Dissertation
- Dissertation - Abstract
- Dissertation - Conclusion
- Dissertation - Discussion
- Dissertation - Hypothesis
- Dissertation - Introduction
- Dissertation - Literature
- Dissertation - Methodology
- Dissertation - Results
- Essay
- GCSE Coursework
- Grant Proposal
- Interview
- Lab Report
- Literature Review
- Marketing Plan
- Math Problem
- Movie Analysis
- Movie Review
- Multiple Choice Quiz
- Online Quiz
- Outline
- Personal Statement
- Poem
- Power Point Presentation
- Power Point Presentation With Speaker Notes
- Questionnaire
- Quiz
- Reaction Paper
- Research Paper
- Research Proposal
- Resume
- Speech
- Statistics problem
- SWOT analysis
- Term Paper
- Thesis Paper
- Accounting
- Advertising
- Aeronautics
- African-American Studies
- Agricultural Studies
- Agriculture
- Alternative Medicine
- American History
- American Literature
- Anatomy
- Anthropology
- Antique Literature
- APA
- Archaeology
- Architecture
- Art
- Asian History
- Asian Literature
- Astronomy
- Aviation
- Biology
- Business
- Canadian Studies
- Chemistry
- Chicago/Turabian
- Classic English Literature
- Communication Strategies
- Communications and Media
- Company Analysis
- Computer Science
- Creative Writing
- Criminal Justice
- Dance
- Design
- Drama
- E-commerce
- Earth science
- East European Studies
- Ecology
- Economics
- Education
- Education Theories
- Educational Theories
- Engineering
- Engineering and Technology
- English
- Ethics
- Family and Consumer Science
- Fashion
- Finance
- Food Safety
- Geography
- Geology
- Harvard
- Healthcare
- High School
- History
- Holocaust
- Internet
- Investments
- IT Management
- Journalism
- Latin-American Studies
- Law
- Legal Issues
- Linguistics
- Literature
- Logistics
- Management
- Marketing
- Master's
- Mathematics
- Medicine and Health
- MLA
- Movies
- Music
- Native-American Studies
- Natural Sciences
- Nature
- Nursing
- Nutrition
- Painting
- Paintings
- Pedagogy
- Pharmacology
- PhD
- Philosophy
- Physics
- Political Science
- Psychology
- Public Relations
- Relation of Global Warming and Extreme Weather Condition
- Religion
- Science
- Shakespeare
- Social Issues
- Social Work
- Sociology
- Sport
- Statistics
- Teacher's Career
- Technology
- Theatre
- Theology
- Tourism
- Trade
- Undergraduate
- Web Design
- West European Studies
- Women and Gender Studies
- World Affairs
- World Literature
- Zoology
Hypothesis Testing and Confidence Intervals, Statistics Problem Example
Hire a Writer for Custom Statistics problem
Use 10% Off Discount: "custom10" in 1 Click 👇
You are free to use it as an inspiration or a source for your own work.

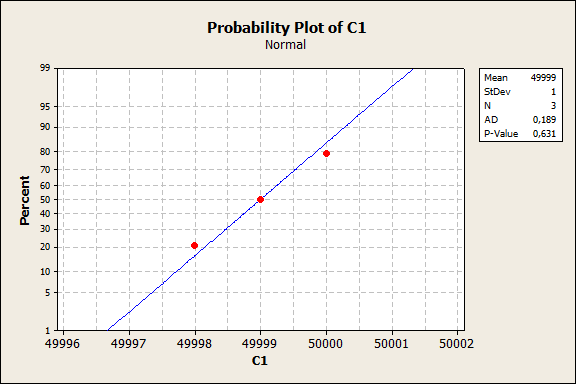
The tests which were conducted were: the 1 sample Z test, the sample Poisson rate and the normal distribution test. The confidence level of the test was 95%. This implies ? level of 0.05. In the first example, the manager speculated on the assumption that the average mean income of a population was less than 50,000 dollars. This is the alternate hypothesis. The null hypothesis states that the average income is more than 50,000 dollars. In the first example, the P- value was determined to be 0.631. The value of 0.631 is greater than the value which was assigned to ?. Consequently, in the first example, the alternate hypothesis is validated.
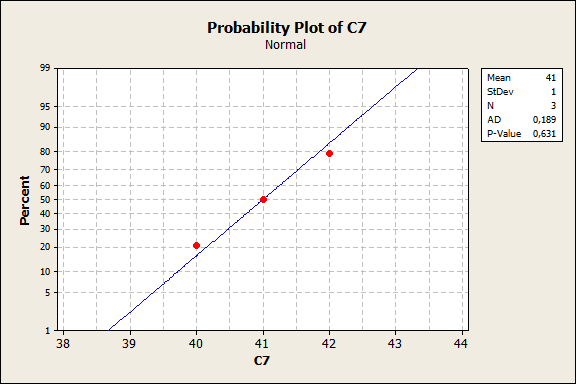
In the second example, the manager speculated that the true population proportion of customers who live in an urban area exceed 40%. This would be the alternate hypothesis. The null hypothesis would be that the true population of customers who live in an area to be less than or equal to 40%. This is the null hypothesis. The P- value which was determined is 0.631. The P value is greater than the value which was assigned to ?. As a result, the alternate hypothesis is validated and the null hypothesis is invalidated for example 2.
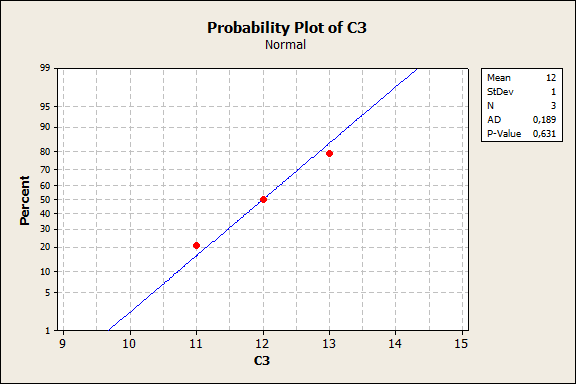
In the third example, the manager speculated that the average number of years lived in the current home is less than thirteen years. This is the alternate hypothesis. The null hypothesis is that the average number of years liven in the current home is greater than or equal to 13 years. This is the null hypothesis. The P- value was determined to be 0.631. The P –value is greater than the value which was assigned to ?. Therefore the alternate hypothesis is accepted and the null hypothesis is rejected.
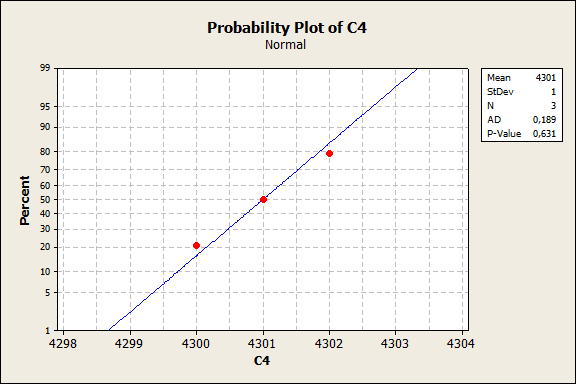
In the fourth example, the manager speculated that the average credit balance for suburban consumers was greater than $4300. This would be the alternate hypothesis. The null hypothesis would be that the average credit balance of the suburban consumers was greater than or equal to $4300. The P- value which was derived was 0.631. The P- value is greater than the value which was assigned to ?. Consequently, the alternate hypothesis is accepted and the null hypothesis is rejected. In this test the Anderson – Darling tests were also administered. The Anderson – Darling test is a statistical examination which demonstrates the aspects of sample of data being taken from an assumed probability distribution (Harry et al., 2010).
Elements Included in a Test Hypothesis
The first element of a test hypothesis is a null hypothesis which provides an assumption with regards to the values of the parameters of a population. These assumptions are considered to be valid until invalidated. The second element of a test hypothesis is the alternate hypothesis. In the alternate hypothesis, an assumption is made which is completely in opposition to the assumptions which are held by the null hypothesis. In the event that the researcher’s assumptions prove to be valid, the alternate hypothesis has validity. In the case where the researcher’s assumptions are invalidated, the alternate hypothesis is validated (Gravetter & Wallnau, 2012).
The next step in the elements of a test hypothesis is the selection of the test statistic. In this step, the test statistic which was used is to be delineated. The test statistic is a mathematical relationship which is used to reject the initial hypothesis. The following element in the test hypothesis is the rejection area. The rejection area is selected in such a manner that the possibility of rejecting the valid hypothesis. This is delineated by the letter ?. The ? coefficient is usually less than 0.05. The level of significance of the test is defined by the letter ? (Gravetter & Wallnau, 2012).
The fifth step of the elements of a test hypothesis is the formulation of assumptions. These assumptions are composed of statements which are made in regards to the population that is being sampled. The sixth step in the elements of a test hypothesis is the computation of the examination statistic and the conclusion which is formed. The alternate hypothesis is invalidated if the test statistic which is applied is found in the values which are in the rejection zone. In the case that the values do not fall within the rejection region, the alternate hypothesis is accepted (Gravetter & Wallnau, 2012).
The final step in the elements of a test hypothesis is the determination of the P value. The P value is the ratio of samples which would not be included in the alternate hypothesis. If the P value is greater than ? value, the hypothesis is accepted. If the P value is less than the value of ?, the alternate hypothesis is rejected and the null hypothesis is accepted (Gravetter & Wallnau, 2012).
Appendix
Average Income

Average Population of Urban Customers

Average Number of Years Liven in Current Home

Average Suburban Credit Balance

References
Greavetter, F. & Wallnau, L. (2012). Statistics for the behavioral sciences. Belmont, CA: Cengage Learning.
Harry, M., Mann, P. S., DeHodgins, O. C., Hubert, R. L. & Lacke, C. .J. (2010). The practitioner’s guide to statistics and Lean Six Sigma for process improvements. Hoboken, N.J.: John Wiley & Sons, Inc.

Stuck with your Statistics problem?
Get in touch with one of our experts for instant help!
Tags:

Time is precious
don’t waste it!
writing help!


Plagiarism-free
guarantee

Privacy
guarantee

Secure
checkout

Money back
guarantee

