 All papers examples
Disciplines

- MLA
- APA
- Master's
- Undergraduate
- High School
- PhD
- Harvard
- Biology
- Art
- Drama
- Movies
- Theatre
- Painting
- Music
- Architecture
- Dance
- Design
- History
- American History
- Asian History
- Literature
- Antique Literature
- American Literature
- Asian Literature
- Classic English Literature
- World Literature
- Creative Writing
- English
- Linguistics
- Law
- Criminal Justice
- Legal Issues
- Ethics
- Philosophy
- Religion
- Theology
- Anthropology
- Archaeology
- Economics
- Tourism
- Political Science
- World Affairs
- Psychology
- Sociology
- African-American Studies
- East European Studies
- Latin-American Studies
- Native-American Studies
- West European Studies
- Family and Consumer Science
- Social Issues
- Women and Gender Studies
- Social Work
- Natural Sciences
- Anatomy
- Zoology
- Ecology
- Chemistry
- Pharmacology
- Earth science
- Geography
- Geology
- Astronomy
- Physics
- Agriculture
- Agricultural Studies
- Computer Science
- Internet
- IT Management
- Web Design
- Mathematics
- Business
- Accounting
- Finance
- Investments
- Logistics
- Trade
- Management
- Marketing
- Engineering and Technology
- Engineering
- Technology
- Aeronautics
- Aviation
- Medicine and Health
- Alternative Medicine
- Healthcare
- Nursing
- Nutrition
- Communications and Media
- Advertising
- Communication Strategies
- Journalism
- Public Relations
- Education
- Educational Theories
- Pedagogy
- Teacher's Career
- Statistics
- Chicago/Turabian
- Nature
- Company Analysis
- Sport
- Paintings
- E-commerce
- Holocaust
- Education Theories
- Fashion
- Shakespeare
- Canadian Studies
- Science
- Food Safety
- Relation of Global Warming and Extreme Weather Condition
Paper Types

- Movie Review
- Essay
- Admission Essay
- Annotated Bibliography
- Application Essay
- Article Critique
- Article Review
- Article Writing
- Assessment
- Book Review
- Business Plan
- Business Proposal
- Capstone Project
- Case Study
- Coursework
- Cover Letter
- Creative Essay
- Dissertation
- Dissertation - Abstract
- Dissertation - Conclusion
- Dissertation - Discussion
- Dissertation - Hypothesis
- Dissertation - Introduction
- Dissertation - Literature
- Dissertation - Methodology
- Dissertation - Results
- GCSE Coursework
- Grant Proposal
- Admission Essay
- Annotated Bibliography
- Application Essay
- Article
- Article Critique
- Article Review
- Article Writing
- Assessment
- Book Review
- Business Plan
- Business Proposal
- Capstone Project
- Case Study
- Coursework
- Cover Letter
- Creative Essay
- Dissertation
- Dissertation - Abstract
- Dissertation - Conclusion
- Dissertation - Discussion
- Dissertation - Hypothesis
- Dissertation - Introduction
- Dissertation - Literature
- Dissertation - Methodology
- Dissertation - Results
- Essay
- GCSE Coursework
- Grant Proposal
- Interview
- Lab Report
- Literature Review
- Marketing Plan
- Math Problem
- Movie Analysis
- Movie Review
- Multiple Choice Quiz
- Online Quiz
- Outline
- Personal Statement
- Poem
- Power Point Presentation
- Power Point Presentation With Speaker Notes
- Questionnaire
- Quiz
- Reaction Paper
- Research Paper
- Research Proposal
- Resume
- Speech
- Statistics problem
- SWOT analysis
- Term Paper
- Thesis Paper
- Accounting
- Advertising
- Aeronautics
- African-American Studies
- Agricultural Studies
- Agriculture
- Alternative Medicine
- American History
- American Literature
- Anatomy
- Anthropology
- Antique Literature
- APA
- Archaeology
- Architecture
- Art
- Asian History
- Asian Literature
- Astronomy
- Aviation
- Biology
- Business
- Canadian Studies
- Chemistry
- Chicago/Turabian
- Classic English Literature
- Communication Strategies
- Communications and Media
- Company Analysis
- Computer Science
- Creative Writing
- Criminal Justice
- Dance
- Design
- Drama
- E-commerce
- Earth science
- East European Studies
- Ecology
- Economics
- Education
- Education Theories
- Educational Theories
- Engineering
- Engineering and Technology
- English
- Ethics
- Family and Consumer Science
- Fashion
- Finance
- Food Safety
- Geography
- Geology
- Harvard
- Healthcare
- High School
- History
- Holocaust
- Internet
- Investments
- IT Management
- Journalism
- Latin-American Studies
- Law
- Legal Issues
- Linguistics
- Literature
- Logistics
- Management
- Marketing
- Master's
- Mathematics
- Medicine and Health
- MLA
- Movies
- Music
- Native-American Studies
- Natural Sciences
- Nature
- Nursing
- Nutrition
- Painting
- Paintings
- Pedagogy
- Pharmacology
- PhD
- Philosophy
- Physics
- Political Science
- Psychology
- Public Relations
- Relation of Global Warming and Extreme Weather Condition
- Religion
- Science
- Shakespeare
- Social Issues
- Social Work
- Sociology
- Sport
- Statistics
- Teacher's Career
- Technology
- Theatre
- Theology
- Tourism
- Trade
- Undergraduate
- Web Design
- West European Studies
- Women and Gender Studies
- World Affairs
- World Literature
- Zoology
Overall Quality Manufacturing, Statistics Problem Example
Hire a Writer for Custom Statistics problem
Use 10% Off Discount: "custom10" in 1 Click 👇
You are free to use it as an inspiration or a source for your own work.

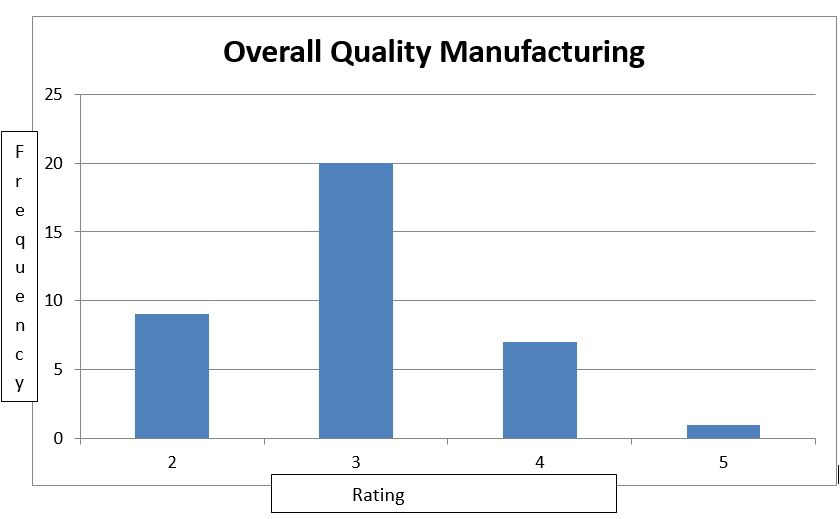
| Overall Quality Manufacturing | Frequency | Percent Frequency |
| 2 | 9 | 24.3% |
| 3 | 20 | 54.1% |
| 4 | 7 | 18.9% |
| 5 | 1 | 2.7% |

The sample size in this case is thirty seven observations. The main measures of central tendency, mean, median, and mode, are all three in this sample. It has a variance of .55 and a standard deviation of .74. This puts 54% of observations within one standard deviation, 43% within two, and 2.7% within three. However, the discreet nature of the possible answers, four possible answers, makes this analysis slightly less valuable than normal.
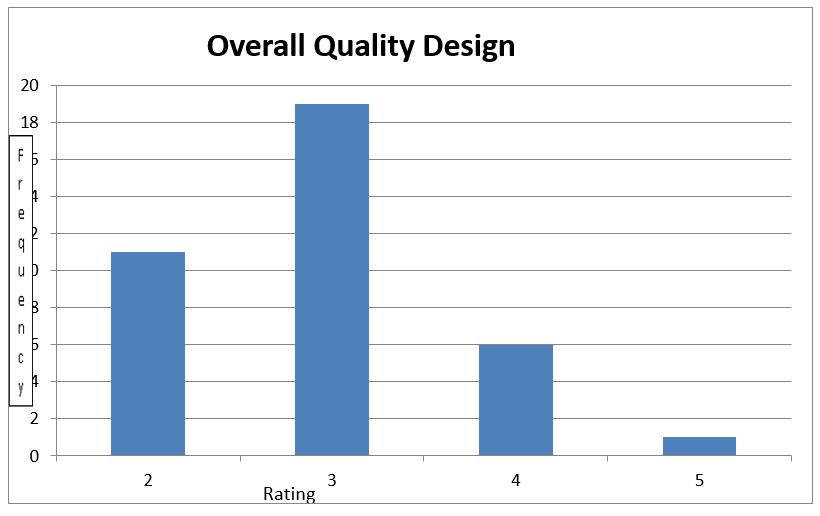
| Overall Quality Design | Frequency | Percent Frequency |
| 2 | 11 | 29.7% |
| 3 | 19 | 51.4% |
| 4 | 6 | 16.2% |
| 5 | 1 | 2.7% |
Again, the sample size here is thirty-seven. The mode and median is again three, but this time the mean is slightly lower at 2.92. The variance is .58 with a standard deviation of .76. 51% of the observation is within one standard deviation, 46% within two, and 2.7% within three. Again the nature of the possible answers does not lend itself well to this sort of analysis.

| Origin | 2 | 3 | 4 | 5 | Total |
| United States | 2 | 8 | 3 | 0 | 13 |
| Pacific Rim | 4 | 8 | 1 | 1 | 14 |
| Europe | 3 | 5 | 2 | 0 | 10 |
| Total | 9 | 21 | 7 | 1 | 37 |
The most significant relationship seems to be between United States manufacturing and quality. Each of the three regions produces a similar proportion of 3 ratings, but the United States has significantly more 4 ratings at the expense of 2 ratings. The Pacific Rim and Europe have similar ratings, except Japan has the only 5 rating given while Europe simply has two four ratings instead of Japan’s one.
| Origin | 2 | 3 | 4 | 5 | Percent of Whole |
| Percent of United States | 15.4 | 61.5 | 23.1 | 0.0 | 35.1 |
| Percent of Pacific Rim | 28.6 | 57.1 | 14.3 | 7.1 | 37.8 |
| Percent of Europe | 30.0 | 50.0 | 20.0 | 0.0 | 27.1 |
| Percent of Whole | 24.3 | 56.8 | 18.9 | 2.7 | 100 |
Again, this shows that the United States has a lower percentage of two ratings and a larger percentage of four ratings than either other region. The Pacific Rim has the only five rating in all the data, but the lowest rate of fours. If you look at four and five ratings together, grouping them in a greater than three category, the Pacific Rim countries have a similar rate to Europe. Also, this rate is slightly below that of the United States greater than three rates. The United States also has a larger rate of three ratings with a lower rate of two ratings than the others.
| Origin | 2 | 3 | 4 | 5 | Total |
| United States | 2 | 10 | 1 | 0 | 13 |
| Pacific Rim | 4 | 6 | 4 | 0 | 14 |
| Europe | 5 | 3 | 1 | 1 | 10 |
| Total | 11 | 18 | 8 | 1 | 37 |
Note: The directions for Step 8 said to describe the relationship between origin and manufacturing rating. Since this was done in Step 4 and since this table represents design rating, I have assumed that it was intended to ask about design rating.
Here it looks like Europe is worse at designing than the other two regions. Half of its ratings are two and even with the single five rating, it still has a lower mean. The United States design produces a great deal of threes, while Japan has the most fours in absolute and rate terms.
| Origin | 2 | 3 | 4 | 5 | Percent of Whole |
| Percent from United States | 15.4 | 76.9 | 7.7 | 0 | 35.1 |
| Percent from Pacific Rim | 28.6 | 42.9 | 28.6 | 0 | 37.8 |
| Percent from Europe | 50 | 30 | 10 | 10 | 27.1 |
| Percent of Whole | 29.7 | 48.6 | 21.6 | 2.7 | 100 |
The three countries are very different in terms of design ratings compared to manufacturing ratings, which were largely similar. The first thing that jumps out is the huge proportion of three ratings among American companies. The Pacific Rim features the highest right of fours. Finally, Europe mostly has the most two ratings. Interestingly, if you divide it into three categories, two, three, greater than three, each region has the highest rate in one category, the lowest in another, and consequentially the middle rate in the third.

Stuck with your Statistics problem?
Get in touch with one of our experts for instant help!
Tags:

Time is precious
don’t waste it!
writing help!


Plagiarism-free
guarantee

Privacy
guarantee

Secure
checkout

Money back
guarantee

