 All papers examples
Disciplines

- MLA
- APA
- Master's
- Undergraduate
- High School
- PhD
- Harvard
- Biology
- Art
- Drama
- Movies
- Theatre
- Painting
- Music
- Architecture
- Dance
- Design
- History
- American History
- Asian History
- Literature
- Antique Literature
- American Literature
- Asian Literature
- Classic English Literature
- World Literature
- Creative Writing
- English
- Linguistics
- Law
- Criminal Justice
- Legal Issues
- Ethics
- Philosophy
- Religion
- Theology
- Anthropology
- Archaeology
- Economics
- Tourism
- Political Science
- World Affairs
- Psychology
- Sociology
- African-American Studies
- East European Studies
- Latin-American Studies
- Native-American Studies
- West European Studies
- Family and Consumer Science
- Social Issues
- Women and Gender Studies
- Social Work
- Natural Sciences
- Anatomy
- Zoology
- Ecology
- Chemistry
- Pharmacology
- Earth science
- Geography
- Geology
- Astronomy
- Physics
- Agriculture
- Agricultural Studies
- Computer Science
- Internet
- IT Management
- Web Design
- Mathematics
- Business
- Accounting
- Finance
- Investments
- Logistics
- Trade
- Management
- Marketing
- Engineering and Technology
- Engineering
- Technology
- Aeronautics
- Aviation
- Medicine and Health
- Alternative Medicine
- Healthcare
- Nursing
- Nutrition
- Communications and Media
- Advertising
- Communication Strategies
- Journalism
- Public Relations
- Education
- Educational Theories
- Pedagogy
- Teacher's Career
- Statistics
- Chicago/Turabian
- Nature
- Company Analysis
- Sport
- Paintings
- E-commerce
- Holocaust
- Education Theories
- Fashion
- Shakespeare
- Canadian Studies
- Science
- Food Safety
- Relation of Global Warming and Extreme Weather Condition
Paper Types

- Movie Review
- Essay
- Admission Essay
- Annotated Bibliography
- Application Essay
- Article Critique
- Article Review
- Article Writing
- Assessment
- Book Review
- Business Plan
- Business Proposal
- Capstone Project
- Case Study
- Coursework
- Cover Letter
- Creative Essay
- Dissertation
- Dissertation - Abstract
- Dissertation - Conclusion
- Dissertation - Discussion
- Dissertation - Hypothesis
- Dissertation - Introduction
- Dissertation - Literature
- Dissertation - Methodology
- Dissertation - Results
- GCSE Coursework
- Grant Proposal
- Admission Essay
- Annotated Bibliography
- Application Essay
- Article
- Article Critique
- Article Review
- Article Writing
- Assessment
- Book Review
- Business Plan
- Business Proposal
- Capstone Project
- Case Study
- Coursework
- Cover Letter
- Creative Essay
- Dissertation
- Dissertation - Abstract
- Dissertation - Conclusion
- Dissertation - Discussion
- Dissertation - Hypothesis
- Dissertation - Introduction
- Dissertation - Literature
- Dissertation - Methodology
- Dissertation - Results
- Essay
- GCSE Coursework
- Grant Proposal
- Interview
- Lab Report
- Literature Review
- Marketing Plan
- Math Problem
- Movie Analysis
- Movie Review
- Multiple Choice Quiz
- Online Quiz
- Outline
- Personal Statement
- Poem
- Power Point Presentation
- Power Point Presentation With Speaker Notes
- Questionnaire
- Quiz
- Reaction Paper
- Research Paper
- Research Proposal
- Resume
- Speech
- Statistics problem
- SWOT analysis
- Term Paper
- Thesis Paper
- Accounting
- Advertising
- Aeronautics
- African-American Studies
- Agricultural Studies
- Agriculture
- Alternative Medicine
- American History
- American Literature
- Anatomy
- Anthropology
- Antique Literature
- APA
- Archaeology
- Architecture
- Art
- Asian History
- Asian Literature
- Astronomy
- Aviation
- Biology
- Business
- Canadian Studies
- Chemistry
- Chicago/Turabian
- Classic English Literature
- Communication Strategies
- Communications and Media
- Company Analysis
- Computer Science
- Creative Writing
- Criminal Justice
- Dance
- Design
- Drama
- E-commerce
- Earth science
- East European Studies
- Ecology
- Economics
- Education
- Education Theories
- Educational Theories
- Engineering
- Engineering and Technology
- English
- Ethics
- Family and Consumer Science
- Fashion
- Finance
- Food Safety
- Geography
- Geology
- Harvard
- Healthcare
- High School
- History
- Holocaust
- Internet
- Investments
- IT Management
- Journalism
- Latin-American Studies
- Law
- Legal Issues
- Linguistics
- Literature
- Logistics
- Management
- Marketing
- Master's
- Mathematics
- Medicine and Health
- MLA
- Movies
- Music
- Native-American Studies
- Natural Sciences
- Nature
- Nursing
- Nutrition
- Painting
- Paintings
- Pedagogy
- Pharmacology
- PhD
- Philosophy
- Physics
- Political Science
- Psychology
- Public Relations
- Relation of Global Warming and Extreme Weather Condition
- Religion
- Science
- Shakespeare
- Social Issues
- Social Work
- Sociology
- Sport
- Statistics
- Teacher's Career
- Technology
- Theatre
- Theology
- Tourism
- Trade
- Undergraduate
- Web Design
- West European Studies
- Women and Gender Studies
- World Affairs
- World Literature
- Zoology
Quantitative Business Analysis, Statistics Problem Example
Hire a Writer for Custom Statistics problem
Use 10% Off Discount: "custom10" in 1 Click 👇
You are free to use it as an inspiration or a source for your own work.

Weighted Means
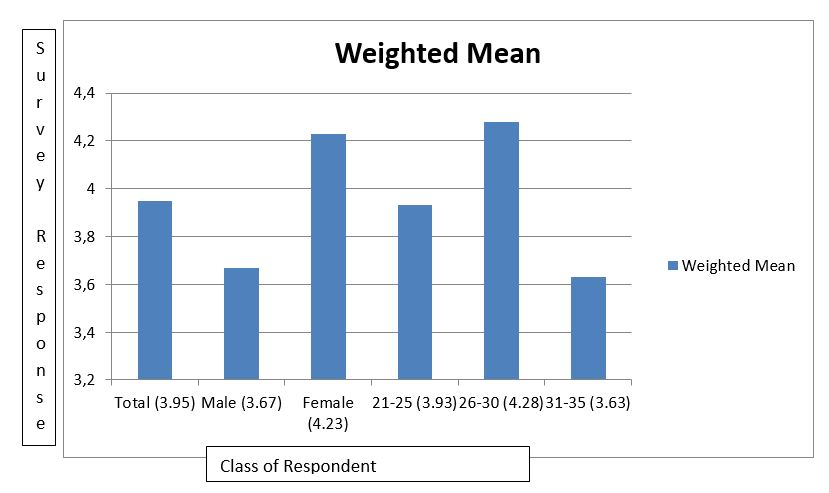
a.) Total: 3.95= ((5*180)+(4*100)+(3*60)+(2*40)+20)/400
b.)Male: 3.67= ((5*72)+(4*47)+(3*38)+(2*28)+15)/200
c.) Female: 4.23= ((5*108)+(4*53)+(3*22)+(2*12)+5)/200
d.)21-25: 3.93= ((5*58)+(4*34)+(3*22)+(2*12)+7)/133
e.)26-30: 4.28= ((5*74)+(4*37)+(3*13)+(2*7)+3)/134
f.)31-35: 3.63= ((5*48)+(4*29)+(3*25)+(2*21)+10)/133

This bar chart represents the weighted means for each group in the survey. There is one for every respondent, two for gender, and three for age group. 26-30 is the highest rating for age group and female is the higher of the two genders.
| Rating | Total | Male | Female | 21-25 | 26-30 | 31-35 |
| 5 | 45% | 36% | 54% | 43.6% | 55.2% | 36.1% |
| 4 | 25% | 23.5% | 26.5% | 25.6% | 27.6% | 21.8% |
| 3 | 15% | 19% | 11% | 16.5% | 9.7% | 18.8% |
| 2 | 10% | 14% | 6% | 9.0% | 5.2% | 15.8% |
| 1 | 5% | 7.5% | 2.5% | 5.2% | 2.2% | 7.5% |
| Percent of Total | 100% | 50% | 50% | 33.3% | 33.4% | 33.3% |

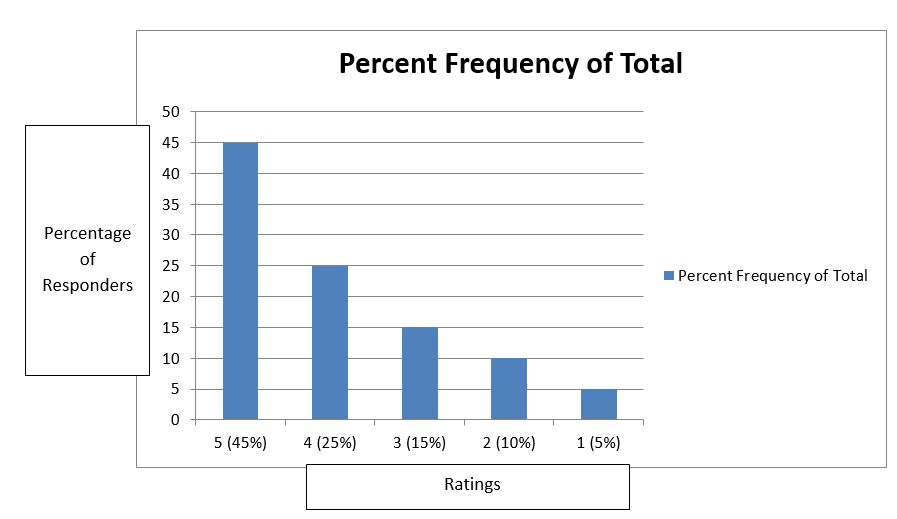
This bar chart represents the percent of respondents who gave the drink each rating. The numbers add up to 100% as all five possible rankings are present in this graph. The lower ratings have lower frequencies of responses.

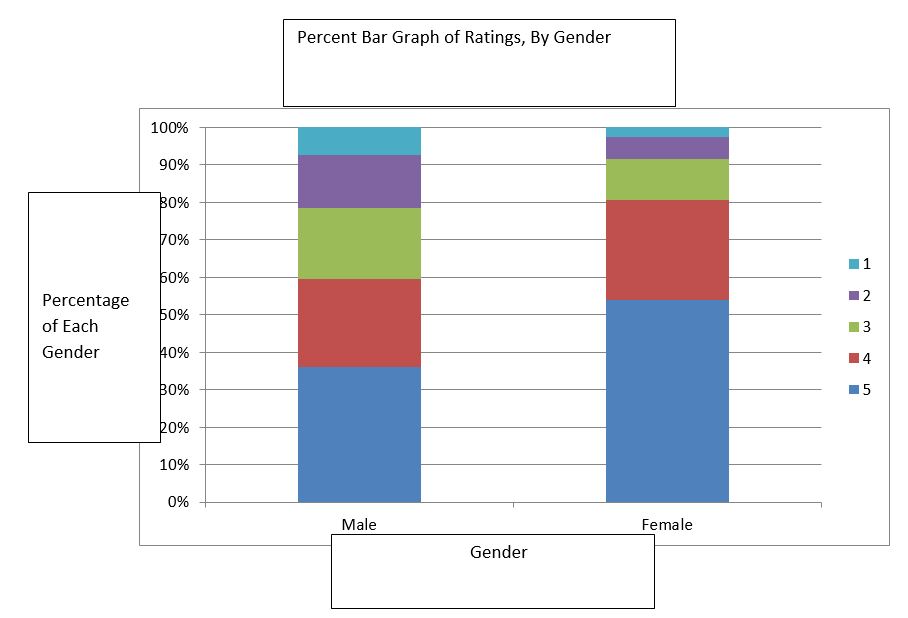
In this graph, the percentage of each rating for both genders is displayed. Ultimately they both add up to 100%, with the size of the color within the bar displaying the percentage of responders by gender who gave that rating. Thirty six percent of males rated the drink a five, 23.5% said it was a four, nineteen percent said three, fourteen said two, and finally seven and a half percent said it was a one. For females, fifty four percent said it was a five, 26.5% went with four, eleven percent rated it as a three, six percent said two, and two and a half percent said it was a one. This shows that the drink is more popular amongst females than males.

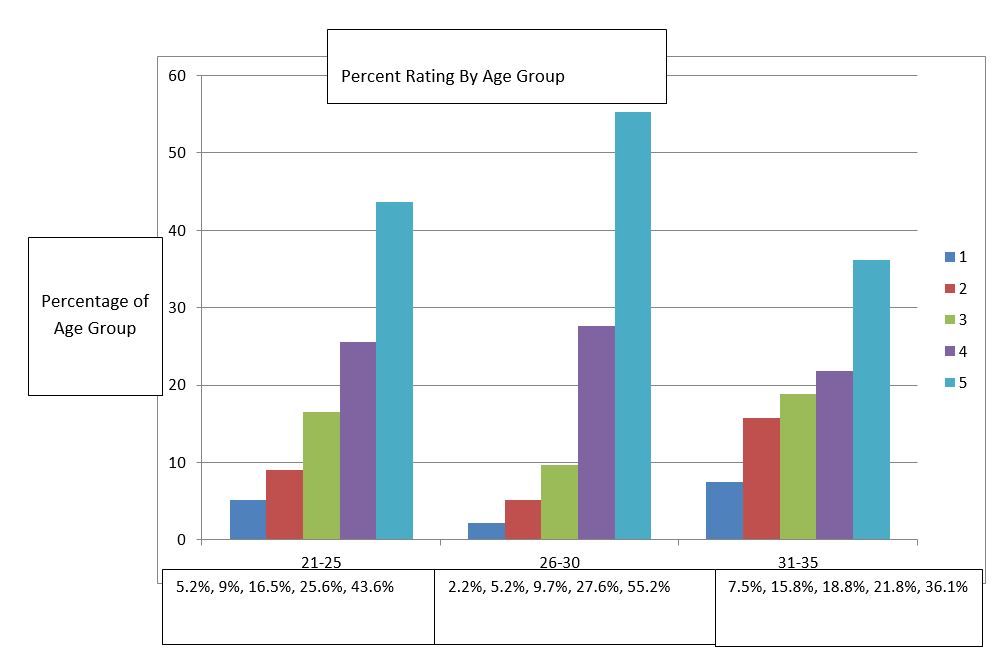
This bar graph displays the percentage of each age group that gave individual rankings to the drink. The data is displayed above due to the fifteen different percentages that needed to be listed.
a.) .805=.540+.265
b.).595=.360+.235
c.) .692=.436+.256
d.).828=.552+.276
e.).578=.361+.218
The immediate thing about the data that jumps out to me is the lack of a bell shaped distribution. I would expect a three to be the most common rating, with ratings becoming less frequent the further they get from there. However, most ratings in each demographic are a five. In fact, there is a correlation between the rating and the frequency of itself. I imagine this is because of the subjective nature of the answers.
Breaking it down by demographics, females rated the beverage much more highly than males did. The 26-30 age group was the most favorable, with 21-25 after, and 31-35 much lower than the other two. Therefore, the most favorable demographic is women in the 26-30 range. However to know this for sure, the gender categories would have to be broken down into age groups themselves. Despite this, it is rather safe to say that females in the 26-30 and slightly less so 21-25 are the demographics to target.

Stuck with your Statistics problem?
Get in touch with one of our experts for instant help!

Time is precious
don’t waste it!
writing help!


Plagiarism-free
guarantee

Privacy
guarantee

Secure
checkout

Money back
guarantee

