 All papers examples
Disciplines

- MLA
- APA
- Master's
- Undergraduate
- High School
- PhD
- Harvard
- Biology
- Art
- Drama
- Movies
- Theatre
- Painting
- Music
- Architecture
- Dance
- Design
- History
- American History
- Asian History
- Literature
- Antique Literature
- American Literature
- Asian Literature
- Classic English Literature
- World Literature
- Creative Writing
- English
- Linguistics
- Law
- Criminal Justice
- Legal Issues
- Ethics
- Philosophy
- Religion
- Theology
- Anthropology
- Archaeology
- Economics
- Tourism
- Political Science
- World Affairs
- Psychology
- Sociology
- African-American Studies
- East European Studies
- Latin-American Studies
- Native-American Studies
- West European Studies
- Family and Consumer Science
- Social Issues
- Women and Gender Studies
- Social Work
- Natural Sciences
- Anatomy
- Zoology
- Ecology
- Chemistry
- Pharmacology
- Earth science
- Geography
- Geology
- Astronomy
- Physics
- Agriculture
- Agricultural Studies
- Computer Science
- Internet
- IT Management
- Web Design
- Mathematics
- Business
- Accounting
- Finance
- Investments
- Logistics
- Trade
- Management
- Marketing
- Engineering and Technology
- Engineering
- Technology
- Aeronautics
- Aviation
- Medicine and Health
- Alternative Medicine
- Healthcare
- Nursing
- Nutrition
- Communications and Media
- Advertising
- Communication Strategies
- Journalism
- Public Relations
- Education
- Educational Theories
- Pedagogy
- Teacher's Career
- Statistics
- Chicago/Turabian
- Nature
- Company Analysis
- Sport
- Paintings
- E-commerce
- Holocaust
- Education Theories
- Fashion
- Shakespeare
- Canadian Studies
- Science
- Food Safety
- Relation of Global Warming and Extreme Weather Condition
Paper Types

- Movie Review
- Essay
- Admission Essay
- Annotated Bibliography
- Application Essay
- Article Critique
- Article Review
- Article Writing
- Assessment
- Book Review
- Business Plan
- Business Proposal
- Capstone Project
- Case Study
- Coursework
- Cover Letter
- Creative Essay
- Dissertation
- Dissertation - Abstract
- Dissertation - Conclusion
- Dissertation - Discussion
- Dissertation - Hypothesis
- Dissertation - Introduction
- Dissertation - Literature
- Dissertation - Methodology
- Dissertation - Results
- GCSE Coursework
- Grant Proposal
- Admission Essay
- Annotated Bibliography
- Application Essay
- Article
- Article Critique
- Article Review
- Article Writing
- Assessment
- Book Review
- Business Plan
- Business Proposal
- Capstone Project
- Case Study
- Coursework
- Cover Letter
- Creative Essay
- Dissertation
- Dissertation - Abstract
- Dissertation - Conclusion
- Dissertation - Discussion
- Dissertation - Hypothesis
- Dissertation - Introduction
- Dissertation - Literature
- Dissertation - Methodology
- Dissertation - Results
- Essay
- GCSE Coursework
- Grant Proposal
- Interview
- Lab Report
- Literature Review
- Marketing Plan
- Math Problem
- Movie Analysis
- Movie Review
- Multiple Choice Quiz
- Online Quiz
- Outline
- Personal Statement
- Poem
- Power Point Presentation
- Power Point Presentation With Speaker Notes
- Questionnaire
- Quiz
- Reaction Paper
- Research Paper
- Research Proposal
- Resume
- Speech
- Statistics problem
- SWOT analysis
- Term Paper
- Thesis Paper
- Accounting
- Advertising
- Aeronautics
- African-American Studies
- Agricultural Studies
- Agriculture
- Alternative Medicine
- American History
- American Literature
- Anatomy
- Anthropology
- Antique Literature
- APA
- Archaeology
- Architecture
- Art
- Asian History
- Asian Literature
- Astronomy
- Aviation
- Biology
- Business
- Canadian Studies
- Chemistry
- Chicago/Turabian
- Classic English Literature
- Communication Strategies
- Communications and Media
- Company Analysis
- Computer Science
- Creative Writing
- Criminal Justice
- Dance
- Design
- Drama
- E-commerce
- Earth science
- East European Studies
- Ecology
- Economics
- Education
- Education Theories
- Educational Theories
- Engineering
- Engineering and Technology
- English
- Ethics
- Family and Consumer Science
- Fashion
- Finance
- Food Safety
- Geography
- Geology
- Harvard
- Healthcare
- High School
- History
- Holocaust
- Internet
- Investments
- IT Management
- Journalism
- Latin-American Studies
- Law
- Legal Issues
- Linguistics
- Literature
- Logistics
- Management
- Marketing
- Master's
- Mathematics
- Medicine and Health
- MLA
- Movies
- Music
- Native-American Studies
- Natural Sciences
- Nature
- Nursing
- Nutrition
- Painting
- Paintings
- Pedagogy
- Pharmacology
- PhD
- Philosophy
- Physics
- Political Science
- Psychology
- Public Relations
- Relation of Global Warming and Extreme Weather Condition
- Religion
- Science
- Shakespeare
- Social Issues
- Social Work
- Sociology
- Sport
- Statistics
- Teacher's Career
- Technology
- Theatre
- Theology
- Tourism
- Trade
- Undergraduate
- Web Design
- West European Studies
- Women and Gender Studies
- World Affairs
- World Literature
- Zoology
Budget and Their Serie a Ranking, Essay Example
Hire a Writer for Custom Essay
Use 10% Off Discount: "custom10" in 1 Click 👇
You are free to use it as an inspiration or a source for your own work.

Is there a relationship between how much money soccer teams have in their budget and their Serie A ranking?
Introduction
Many people enjoy watching soccer, however very few people can explain why some teams are stronger than others. Almost everybody knows that the strength of a team is related to strength of the team’s players. However, it is difficult to determine what makes the players strong. However, since many soccer teams are able to buy the best players if they have enough money, it is likely that teams with more money in their budget will have better players. Therefore, I would like to investigate whether there is a relationship between the amount of money that soccer teams have in their budget and their Serie A ranking. I hypothesize that teams with more money in their budget will have better players, which will allow them to have a better performing team. In short, more money in the budget will lead to a higher rank.
In this project, various statistical methods will be used to determine the association between budget and rank. Budget will be treated as the independent variable and rank will be the dependent variable. This project will analyze all 20 teams present in the Italian SerieA1, and the data will be taken from the Italian soccer federation and various newspapers. Descriptive statistics, correlation, chi square analysis, cumulative frequency, and percent increase will will be performed in order to discover if a true relationship exists.
Plan of Investigation
- Determine the budget each Serie A team has for the season and their final ranking
- Determine the distribution of the data using a histogram
- Summarize data using descriptive statistical tests including mean, standard deviation, and median, and mode of the budget
- Summarize data using cumulative frequency according to quartile
- Determine the correlation between budget and rank
- Perform a chi square test or Fisher’s exact test to determine the independence of the relationship
Results
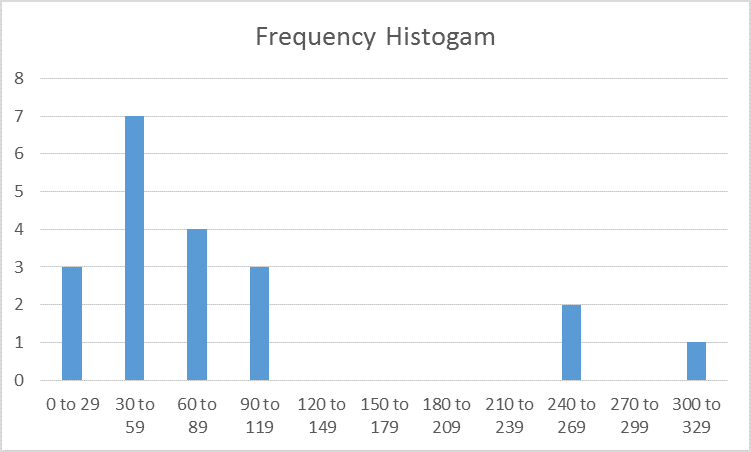
To determine the distribution of the data, a frequency histogram was made using Microsoft Excel. The graph can be seen below in figure 1.
Budget in Million €
Figure 1 Frequency histogram of Serie A team budgets.
Figure 1 demonstrates that a majority of the teams have a budget in the 0 to 119 million € range, although a few teams have 240 to 269 and 300 to 239 million € budgets. There is a large gap between budgets on the lower end and budgets on the higher end, and we can consider budgets that range from 0 to 119 million € to be low, while budgets that range from 240 to 329 million € should be considered high.
To determine the central tendency of the data, which is difficult to predict purely based on the distribution seen in figure 1, the mean, standard deviation, and median of the budget will be determined. The mean will be calculated in Excel using the AVERAGE function, standard deviation will be calculated using STDEV.P, median will be calculated using MEDIAN, and mode will be calculated using MODE.SNGL. The mean budget of Serie A ranked players is 90.75 million €, with a standard deviation of 84.15 million €. The median is 60.5 million € and the mode is 49 million €. Since the budget is not normally distributed, the best measurement of central tendency is the median budget, which is 60.5 million €.
Figure 2 below is a scatter plot of budget in million € versus the rank of the teams. There appears to be a negative correlation, however, it is necessary to determine the best regression for this data.
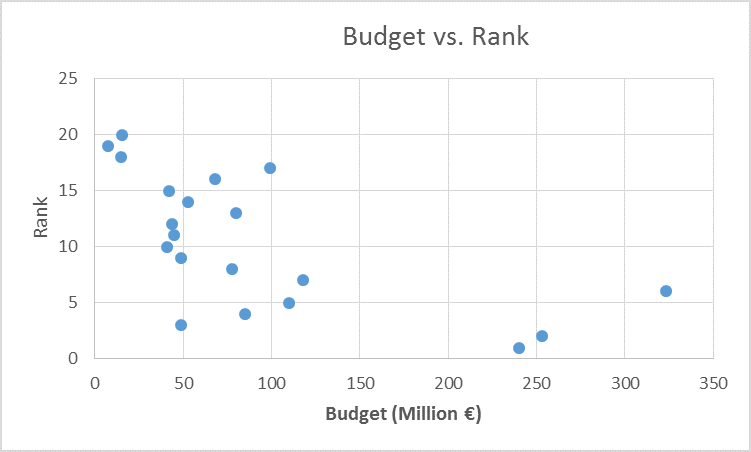
Figure 2 Scatterplot of budget compared to rank.
Figure 3 below shows a scatter plot of budget compared to rank using a linear regression.
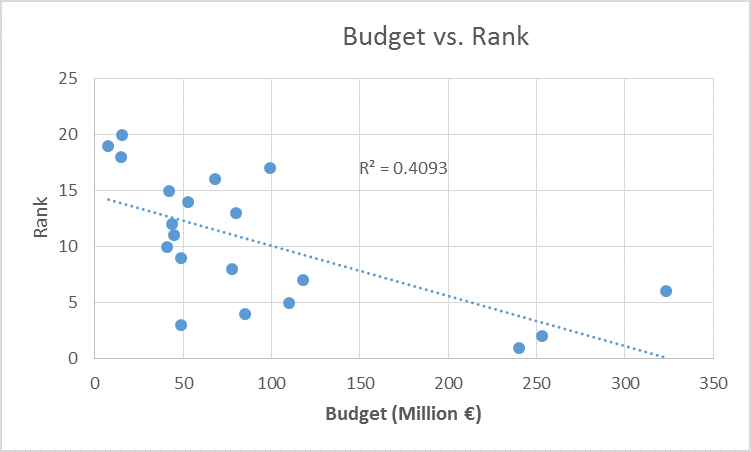
Figure 3 Scatterplot of budget compared to rank with linear regression.
Figure 4 below shows a scatter plot of budget compared to rank using log regression.
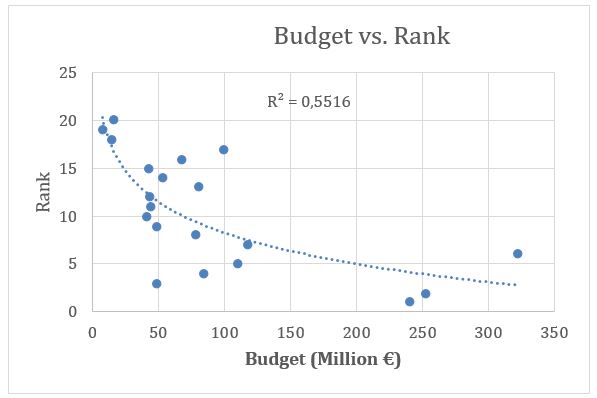
Figure 4 Scatterplot of budget compared to rank with log regression.
Figure 5 below shows a scatter plot of budget compared to rank using exponential regression.
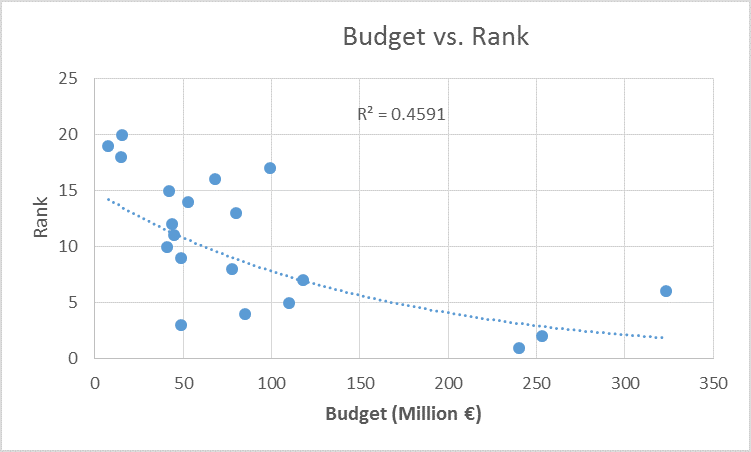
Figure 5 Scatterplot of budget compared to rank with exponential regression.
Since the log regression shows the highest correlation value, which is .55, this is the best model for this set of data.
Table 1 below shows the frequency and cumulative frequency data for the budget range.
Table 1 Cumulative frequency data for budget.
In most situations, 4×4 tables for the c2 test is preferable. However, in this case, the budget falls within two distinct groups that were previously classified as high and low. The frequency histogram indicated that budgets that range from 0 to 119 million € are low, while budgets that range from 240 to 329 million € are high. The ranks among Serie A teams can be dichotomized in a similar way. Teams who ranked 1 – 10 could be considered high ranking, while teams who ranked 11 – 20 could be considered low ranking. As a result, a 2 x 2 table will made that place the teams into one of these four categories. Observed data is in table 2 and expected data is in table 3.
| Rank | TOTAL | |||
|
Budget
|
High (1-10) | Low (11-12) | ||
| High (240 to 329 million €) | 3 | 7 | 10 | |
| Low (0 to 119 million €) | 0 | 10 | 10 | |
| TOTAL | 3 | 17 | 20 | |
Table 2 Observed data according to high and low rank and high and low budget.
| Rank | TOTAL | |||
|
Budget
|
High (1-10) | Low (11-12) | ||
| High (240 to 329 million €) | 1.5 | 8.5 | 10 | |
| Low (0 to 119 million €) | 1.5 | 8.5 | 10 | |
| TOTAL | 3 | 17 | 20 | |
Table 3 Expected data according to high and low rank and high and low budget.
Since a 2×2 table was necessary, and there is a sample of less than 5 in one or more cells, the Fisher’s exact test, rather than the c2 test must be used. The Yates correction was not applied because it is not relevant to the Fisher’s exact test, which is the preferred test for this particular sample group, as demonstrated above. The two-tailed value for the Fisher’s exact test is p is equal to 0.210. Therefore the null hypothesis that Serie A teams with high budgets are different than Serie A teams with low budgets cannot be rejected.
Interpretation and Validity
The Pearson correlation calculated shown in figures 3 through 5 demonstrates that there is a negative relationship between team rank and budget. It appears that teams with the higher Serie A ranks have lower budgets. Therefore, it is likely that Serie A rank is purely based on the talent of the winning teams. While coaches try to increase the talent of their team by hiring the best players, this is not always beneficial. The Fisher’s exact test agrees with this finding. The null hypothesis states that the teams with high ranks and high budgets are equivalent to the team with low ranks and low budgets. The statistic showed that we cannot reject this null hypothesis, meaning that the performance of the teams in Serie A was not impacted by the budget.
Currently, this study only has internal validity for the teams that ranked in the top 20 in Serie A. It may be beneficial to determine whether this trend is true for all soccer teams. A followup study should be conducted that looks at 100 professional soccer teams from around the world. Team budget should be compared to number of wins to determine which teams are the best. This larger sample size would be more beneficial because it allows random sampling of world teams and would ensure that the data collected is closer to normal. It is possible that the budget is related to team performance, even though I discovered this is not true for the teams in Serie A.
Appendix
| Rank | Team | Budget € |
| 12 | Atalanta | 43.500.000 |
| 9 | Bologna | 49.000.000 |
| 15 | Cagliari | 42.000.000 |
| 11 | Catania | 45.000.000 |
| 20 | Cesena | 15.700.000 |
| 10 | Chievo | 41.000.000 |
| 13 | Fiorentina | 80.000.000 |
| 17 | Genoa | 99.000.000 |
| 6 | Inter | 323.000.000 |
| 1 | Juventus | 240.000.000 |
| 4 | Lazio | 85.000.000 |
| 18 | Lecce | 15.000.000 |
| 2 | Milan | 253.000.000 |
| 5 | Napoli | 110.000.000 |
| 19 | Novara | 7.700.000 |
| 16 | Palermo | 68.000.000 |
| 8 | Parma | 78.000.000 |
| 7 | Roma | 118.000.000 |
| 14 | Siena | 53.000.000 |
| 3 | Udinese | 49.000.000 |
Works Cited
ESPN FC. Italian Serie A. Web. 11 Feb. 2014. <http://espnfc.com/league/_/id/ita.1/italian-serie-a?cc=5901>
Serie A Ranks. 2011-2012. Web. 30 Jan. 2014. <http://sport.sky.it/sport/statistiche/calcio/2011_2012/serie_a/classifica.html>

Stuck with your Essay?
Get in touch with one of our experts for instant help!

Time is precious
don’t waste it!
writing help!


Plagiarism-free
guarantee

Privacy
guarantee

Secure
checkout

Money back
guarantee

