 All papers examples
Disciplines

- MLA
- APA
- Master's
- Undergraduate
- High School
- PhD
- Harvard
- Biology
- Art
- Drama
- Movies
- Theatre
- Painting
- Music
- Architecture
- Dance
- Design
- History
- American History
- Asian History
- Literature
- Antique Literature
- American Literature
- Asian Literature
- Classic English Literature
- World Literature
- Creative Writing
- English
- Linguistics
- Law
- Criminal Justice
- Legal Issues
- Ethics
- Philosophy
- Religion
- Theology
- Anthropology
- Archaeology
- Economics
- Tourism
- Political Science
- World Affairs
- Psychology
- Sociology
- African-American Studies
- East European Studies
- Latin-American Studies
- Native-American Studies
- West European Studies
- Family and Consumer Science
- Social Issues
- Women and Gender Studies
- Social Work
- Natural Sciences
- Anatomy
- Zoology
- Ecology
- Chemistry
- Pharmacology
- Earth science
- Geography
- Geology
- Astronomy
- Physics
- Agriculture
- Agricultural Studies
- Computer Science
- Internet
- IT Management
- Web Design
- Mathematics
- Business
- Accounting
- Finance
- Investments
- Logistics
- Trade
- Management
- Marketing
- Engineering and Technology
- Engineering
- Technology
- Aeronautics
- Aviation
- Medicine and Health
- Alternative Medicine
- Healthcare
- Nursing
- Nutrition
- Communications and Media
- Advertising
- Communication Strategies
- Journalism
- Public Relations
- Education
- Educational Theories
- Pedagogy
- Teacher's Career
- Statistics
- Chicago/Turabian
- Nature
- Company Analysis
- Sport
- Paintings
- E-commerce
- Holocaust
- Education Theories
- Fashion
- Shakespeare
- Canadian Studies
- Science
- Food Safety
- Relation of Global Warming and Extreme Weather Condition
Paper Types

- Movie Review
- Essay
- Admission Essay
- Annotated Bibliography
- Application Essay
- Article Critique
- Article Review
- Article Writing
- Assessment
- Book Review
- Business Plan
- Business Proposal
- Capstone Project
- Case Study
- Coursework
- Cover Letter
- Creative Essay
- Dissertation
- Dissertation - Abstract
- Dissertation - Conclusion
- Dissertation - Discussion
- Dissertation - Hypothesis
- Dissertation - Introduction
- Dissertation - Literature
- Dissertation - Methodology
- Dissertation - Results
- GCSE Coursework
- Grant Proposal
- Admission Essay
- Annotated Bibliography
- Application Essay
- Article
- Article Critique
- Article Review
- Article Writing
- Assessment
- Book Review
- Business Plan
- Business Proposal
- Capstone Project
- Case Study
- Coursework
- Cover Letter
- Creative Essay
- Dissertation
- Dissertation - Abstract
- Dissertation - Conclusion
- Dissertation - Discussion
- Dissertation - Hypothesis
- Dissertation - Introduction
- Dissertation - Literature
- Dissertation - Methodology
- Dissertation - Results
- Essay
- GCSE Coursework
- Grant Proposal
- Interview
- Lab Report
- Literature Review
- Marketing Plan
- Math Problem
- Movie Analysis
- Movie Review
- Multiple Choice Quiz
- Online Quiz
- Outline
- Personal Statement
- Poem
- Power Point Presentation
- Power Point Presentation With Speaker Notes
- Questionnaire
- Quiz
- Reaction Paper
- Research Paper
- Research Proposal
- Resume
- Speech
- Statistics problem
- SWOT analysis
- Term Paper
- Thesis Paper
- Accounting
- Advertising
- Aeronautics
- African-American Studies
- Agricultural Studies
- Agriculture
- Alternative Medicine
- American History
- American Literature
- Anatomy
- Anthropology
- Antique Literature
- APA
- Archaeology
- Architecture
- Art
- Asian History
- Asian Literature
- Astronomy
- Aviation
- Biology
- Business
- Canadian Studies
- Chemistry
- Chicago/Turabian
- Classic English Literature
- Communication Strategies
- Communications and Media
- Company Analysis
- Computer Science
- Creative Writing
- Criminal Justice
- Dance
- Design
- Drama
- E-commerce
- Earth science
- East European Studies
- Ecology
- Economics
- Education
- Education Theories
- Educational Theories
- Engineering
- Engineering and Technology
- English
- Ethics
- Family and Consumer Science
- Fashion
- Finance
- Food Safety
- Geography
- Geology
- Harvard
- Healthcare
- High School
- History
- Holocaust
- Internet
- Investments
- IT Management
- Journalism
- Latin-American Studies
- Law
- Legal Issues
- Linguistics
- Literature
- Logistics
- Management
- Marketing
- Master's
- Mathematics
- Medicine and Health
- MLA
- Movies
- Music
- Native-American Studies
- Natural Sciences
- Nature
- Nursing
- Nutrition
- Painting
- Paintings
- Pedagogy
- Pharmacology
- PhD
- Philosophy
- Physics
- Political Science
- Psychology
- Public Relations
- Relation of Global Warming and Extreme Weather Condition
- Religion
- Science
- Shakespeare
- Social Issues
- Social Work
- Sociology
- Sport
- Statistics
- Teacher's Career
- Technology
- Theatre
- Theology
- Tourism
- Trade
- Undergraduate
- Web Design
- West European Studies
- Women and Gender Studies
- World Affairs
- World Literature
- Zoology
Relationship Between Hours Playing Sport and GPA, Research Paper Example
Hire a Writer for Custom Research Paper
Use 10% Off Discount: "custom10" in 1 Click 👇
You are free to use it as an inspiration or a source for your own work.

Is there a relationship between hours playing sport and GPA?
Introduction
Many individuals believe that there is a relationship between participating in sports and GPA level, although there is some disagreement as to the direction of this relationship. Some people believe that sports increases an individual’s ability to perform well in school. The rationale for this is that some schools require the GPA of their athletes to be at least passing. Others believe that when students participate in sports, they are able to budget the time that they use to do school work more effectively and that healthy students are able to perform better academically. On the other hand, some people believe that playing sports leads to a decrease in a student’s GPA. These people claim that student’s dedicate too much time to the sports they play, which detracts from the time they spend doing school work, which leads to a lower GPA.
This study aims to determine whether there is a positive or negative association between number of sports played and GPA. To do so, 20 students who participate in school sports will be surveyed. They will be asked how many hours per week they dedicate to sports practices scheduled by the school teams and how many hours outside of school they play this sport. The amount of hours dedicated to scheduled in school practice will be verified by their coaches. They will also be asked to provide a copy of their report card. Their name will be removed during the analysis to protect the identity of the students.
The null hypothesis is that individuals who play many hours of sports and only a few hours of sports will have an equal GPA. The alternate hypothesis is that there will be a negative relationship between the number of hours of sports played and GPA.
Plan of Investigation
- Collect information about GPA and hours of sports played from 20 students
- Create a scatter plot that compares the relationship between number of sports played per week (independent variable) and GPA (dependent variable)
- Create a scatter plot using three different regressions, linear, log, and exponential, and determine which regression best represents the data based on which one has the highest R2
- The mean, median, and mode will be determined for both hours of sports played and GPA
- Cumulative frequency and first and third quartiles for hours of sports played and GPA will be measured
- A c2 test will be performed to determine if hours of sports played and GPA are independent
- The results will then be evaluated and the validity of the results will be assessed
Data
Table 1 below lists the raw data collected from the 20 students that participate on school sports teams. The total hours of sports played per week included scheduled school practices and the amount of hours the students play on their own outside of school.
| Total Hours of Sports Played | GPA |
| 12 | 3.6 |
| 20 | 3.2 |
| 5 | 3.8 |
| 4 | 3.7 |
| 32 | 2.9 |
| 25 | 2.8 |
| 30 | 2.4 |
| 10 | 3.6 |
| 5 | 3.4 |
| 3 | 3.7 |
| 23 | 3.1 |
| 19 | 2.9 |
| 33 | 2.9 |
| 10 | 3.4 |
| 8 | 3.8 |
| 7 | 4 |
| 4 | 4 |
| 3 | 3.5 |
| 29 | 2.7 |
| 3 | 4 |
Table 1 Raw data listing the hours of sports played per week and GPA of the surveyed students
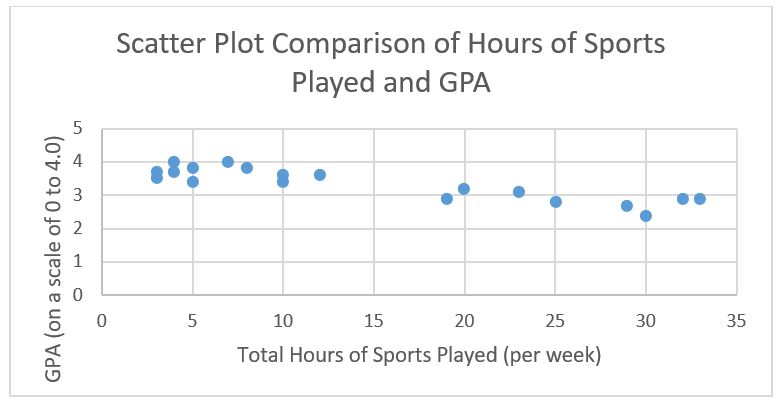
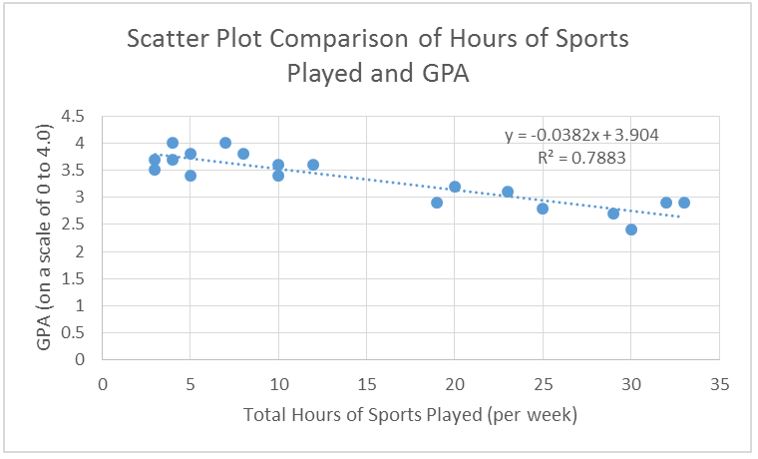
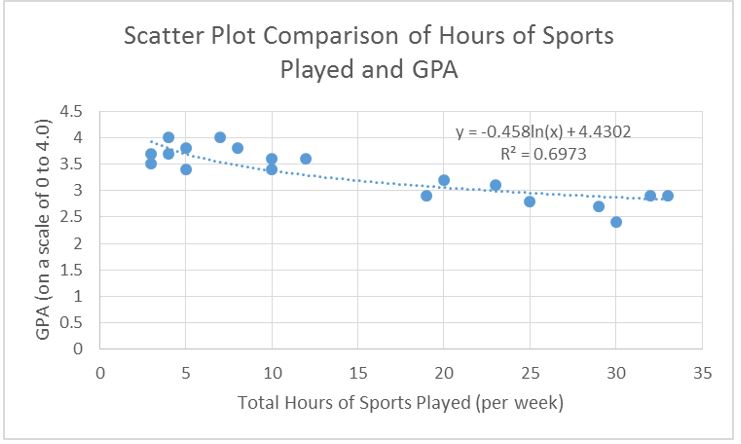
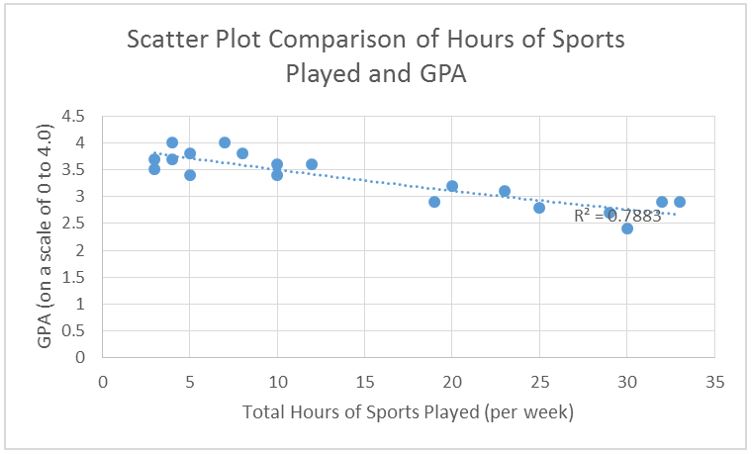
Figure 1 below is a scatter plot that compared the total hours of sports played per week (the independent variable) to the GPA of the students without accounting for regression. It is clear that there is a downwards trend, which indicates that the more hours of sports that students play per week, the less likely they are to have a high GPA. Likewise, the students that spend less hours per week playing school sports have a higher GPA. Figures 2 through 4 show the same relationship demonstrated in figure 1 with different regressions to determine which fit best represents the data.

Figure 1 Scatterplot comparison of hours of sports played and GPA without regression

Figure 2 Scatterplot comparison of hours of sports played and GPA with linear regression

Figure 3 Scatterplot comparison of hours of sports played and GPA with logarithmic regression

Figure 4 Scatterplot comparison of hours of sports played and GPA with exponential regression
Figures 2 to 4 show that either an exponential regression or linear regression is the best fit for this data because they both have a R2 of 0.7883, which is the greatest fit of these figures.
Next, the mean, median, and mode were determined for both number of hours of sports played per week in GPA to determine measures of central tendency for both variables. These values were calculated using Microsoft Excel functions AVERAGE for mean, MEDIAN for median, and MODE.SNGL for mode. It was found that the mean total hours of sports played per week was 14.84, the median was 10, and the mode was 5. The mean GPA was 3.33, the median was 3.4 and the mode was 2.9. It is likely that the data for each variable is approximately normally distributed because the mean values and median values for both are about equal.
To determine the spread of the data, the cumulative frequency of both hours of sports played and GPA was performed according to quartile. To do so, the QUARTILE command was used in Microsoft excel. In each calculation, the section of the array relevant to the calculation and the quartile to be determined was entered. Tables 2 and 3 represent the calculated quartiles for both variables.
| Quartile | Value |
| 1st | 5 |
| 2nd | 10 |
| 3rd | 24 |
| 4th | 33 |
Table 2 Hours of sports played according to quartile
| GPA | |
| Quartile | Value |
| 1st | 2.9 |
| 2nd | 3.4 |
| 3rd | 3.7 |
| 4th | 4 |
Table 3 GPA according to quartile
Next, cumulative frequency was calculated manually using excel. According to the values indicated by the quartile calculations. Table 4 below shows the frequency and cumulative frequency of total hours of sports played and table 5 below shows the frequency and cumulative frequency of the GPA.
| Cumulative Frequency of Hours of Sports Played | ||||
| Category | Frequency | Cumulative Frequency | ||
| Below 5 | 4 | 4 | ||
| Greater than 5 and Less Than 10 | 4 | 8 | ||
| Greater than 10 and Less Than 24 | 6 | 14 | ||
| Greater than 24 and Less Than 33 | 6 | 20 | ||
| Cumulative Frequency of GPA | ||
| Category | Frequency | Cumulative Frequency |
| Below 2.9 | 3 | 3 |
| Greater than 2.9 and Less Than 3.4 | 5 | 8 |
| Greater than 3.4 and Less than 3.7 | 5 | 13 |
| Greater than 3.7 and Less than 4 | 7 | 20 |
Table 4 Cumulative frequency and frequency of hours of sports played
Table 5 Cumulative frequency and frequency of GPA
Next, to determine independence, a c2 test was performed. First, the values were sorted into a 4×4 table. These values was sorted according to their quartile categorization according to each variable.
| Hours of Sports Played | TOTAL | |||||
|
GPA |
Below 25% | Between 25% and 50% | Between50% and 75% | Above 75% | ||
| Below 25% | 4 | 0 | 0 | 0 | 4 | |
| Between 25% and 50% | 0 | 5 | 0 | 0 | 5 | |
| Between50% and 75% | 0 | 0 | 5 | 0 | 5 | |
| Above 75% | 0 | 0 | 1 | 5 | 6 | |
| TOTAL | 4 | 5 | 6 | 5 | 20 | |
Table 6 4×4 table
Since a majority of these boxes contained a value of 5 or less, the 4×4 table was condensed into a 2×2 table where the values were dichotomized at the median. Values below the 50th percentile or median were to be considered low and values above the 50th percentile/median were considered to be high.
| Few Hours of Sports Played | Many Hours of Sports Played | TOTAL | |
| Low GPA | 9 | 0 | 9 |
| High GPA | 0 | 11 | 11 |
| TOTAL | 9 | 11 | 20 |
Table 7 2×2 table
Since a 2×2 table was used, the Yates correction was applied.
The expected frequencies are shown below in table 8.
| Few Hours of Sports Played | Many Hours of Sports Played | TOTAL | |
| Low GPA | 4.05 | 4.95 | 9 |
| High GPA | 4.05 | 6.95 | 11 |
| TOTAL | 8.10 | 11.90 | 20 |
Table 8 2×2 table of expected frequencies
The c2 test was calculated by hand. The c2 value was 16.16 with 1 degree of freedom. The two-tailed p-value was less than 0.001, so these results are statistically significant.
Interpretation and Validity
There is a negative relationship between total hours of sports played per week and GPA. As the number of hours of sports played by student’s increases, their GPA decreases; as the number of hours of sports played by student’s decreases, their GPA increases. As a result, it is important to inform students that their primary responsibility in school is academics and if they wish to perform well, they should consider limiting the number of hours of sports they play per week. In addition, the relationship between these two variables is independent as confirmed by the c2 test.
It is important to consider that this study only has internal validity. Since it was conducted only for students in my high school, it is true for these individuals. To increase the power and likelihood that this study is applicable to the school as a whole, it might be worthwhile to repeat it using a larger sample size. If this larger study confers the same results as this initial one, it is likely that this trend applies to student’s school wide. It may also be useful to determine other factors that affect the relationship between hours of sports played and GPA. There may be certain qualities that students hold that will allow them to perform well in school even if they play many hours of sports. Since extracurricular participation and GPA are both important factors that universities consider when selecting applicants, it may be useful to evaluate these traits.
Conclusion
This study showed that there is a negative, independent relationship between number of hours of sports played and GPA. As number of hours of sports played increases, GPA decreases. Therefore, it is important for students who want high GPA’s to spend most of their time studying rather than playing sports.

Stuck with your Research Paper?
Get in touch with one of our experts for instant help!

Time is precious
don’t waste it!
writing help!


Plagiarism-free
guarantee

Privacy
guarantee

Secure
checkout

Money back
guarantee

