The Middle Fork Feather River, Research Paper Example
The Feather River in the State of California is the about 114km long at its main stream, 350 km from its headwater tributary, with a drainage basin spread out to 16,000 sq km. It has four long tributaries, most commonly known as forks, the North Fork, the Middle Fork, the South Fork and the West Fork, which join together to make the main stream in Lake Oroville. This area is famous for its rich history of gold mining in the 19th century. It is the main source of water for California, which is why its water is also used for hydroelectric generation in the state. In terms of flow and watershed capacity, the North Fork is the biggest of its watersheds. Next to it comes the Middle Fork, leaving out the South and the West Forks to be the smallest in this regard.
The water of the North and the Middle Forks of the Feather River are important in terms of recreational, fishery, and aquatic habitat purposes. It also adds to the supply for agricultural, industrial and municipal uses for the locals that live around. For centuries they have used the system to their advantage and when properly maintained and monitored will keep on doing so even for a longer period of time.
The Middle Fork Feather River is nearly 90 miles long flowing from Sierra Valley, in Plumas County to Oroville Lake. Its tributaries join in at different locations to make up the middle stream. This Middle Fork of the river covers most of the area of the Plumas and the Sierra counties. Here the land is used mainly for agricultural purposes. These areas are major producers of alfalfa and grain hay, range pasture, beef cattle and nut crops. The water is used for urban, industrial and agricultural purposes and that is the reason its quality has to be maintained.
Irrigation is mainly done in the Sierra Valley that drains above Portola to the upper parts of the Middle Fork Feather River, the Indian Valley that drains near Greenville to the Indian Creek, and to the American Valley that drains near Quincy to the Greenhorn and Spanish Creek. Goodrich Creek, Mohawk Valley and Long Valley also get the water of the river for irrigation purposes.
Even the pesticide usage in the area is low; the weed problem is handled by the use of herbicides in the area that are not much toxic.
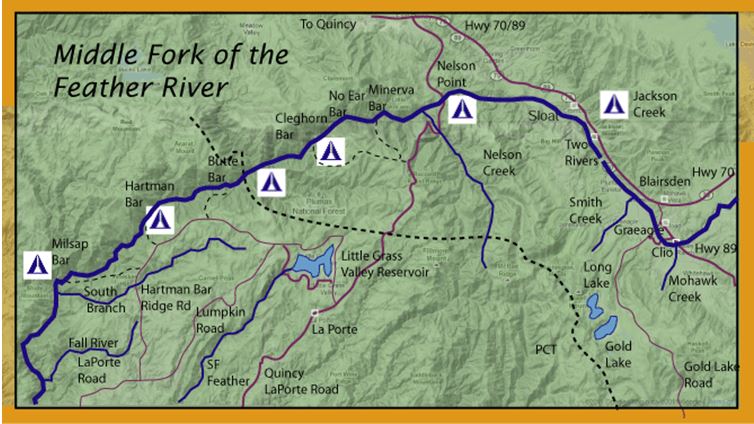
Map of Middle Fork Feather River. < http://stevenojai.tripod.com/mffeather.htm >
In 1850’s gold was discovered in the Mill Creek and along the American Valley, due to which settlements started to appear along different counties, which made it a very populated area. Ultimately farmers settled their ranches and started raising cattle for beef and dairy. The meadows in the valley were drained to get more land to grow grazing grass and hay. By 1900 the cattle grazing had intensely damaged the stream area within the valley and erosion started.
Slowly and gradually, people moved from mining to other businesses. They started cutting trees for logging and instead of animals, tractors and vehicles took place, thus giving more way to erosion and ultimately destruction of beauty and natural resources in the area. These were the reasons that brought the thought of water reservation in the area, so that the water resources could be utilized and the natural reservoir should be kept from being destroyed.
The irrigation system depends largely on the melting snow from the upper watershed. Irrigation started when the settlers thought of the creeks and streams to provide water to their fields. Dairy was the number one produced commodity of the area. In 1856, there were 700 head of cattle in this area. By the time 1880 started, there were almost 10,000 head. As major portion of the land was producing hay for the cattle so it was not difficult to feed as many animals. Dairy production and animal husbandry went to such high extreme in the area that the government was having a difficult time controlling and managing the prices stable. So they were asked to cut them short by 1950. Some of the areas were also rich in fishery. Among them Goodrich Creek was one.
Hydrology
The Middle Fork Feather River is spread over almost 738.888 acres of land, which makes about 33 percent of the total Feather River watershed area. The Middle Fork is divided into further six sub-watersheds. Its basin consists of alluvial deposits, which are located within the Pliocene and Miocene volcanic rocks, and Paleozoic marine deposits.
According to a survey by California Department of Water Resources in 1997, the total land used for agriculture in the watershed area is only 3.5% of the total 2.2 million acres, which falls mostly in the Plumas and sierra Counties. This means that these two counties use the most of water. According to the 2005 survey by the Integrated Regional Water Management Plan, Sierra County was the largest water using area in the Feather River Watershed.
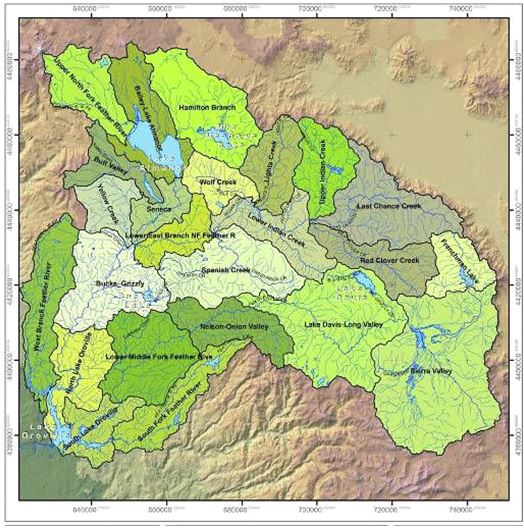
Map from the Integrated Regional Watershed Management Plan by the Feather River Watershed Authority (http://www.countyofplumas.com/publicworks/watershed/IRWMP_063005.pdf)
Middle Fork is important in many ways to the local settlements around. Sierraville, Portola and Loyalton depend on its water for recreation and agricultural purposes. It should be monitored for the sole purpose of keeping it clean and to keep its quality to higher level. Its monitoring will allow proper usage and would enable the people to keep it from polluting. Monitoring stations have already been set at different locations all around it. Water that comes from the Feather River is used to provide hydroelectricity, that is about 4000 MW. About 3.2 million acre-feet of it is used to fulfill industrial, urban and agricultural usage. These contribute to the important economical input of the area. Other incomes include cattle, agriculture, mining and timber.
The watershed monitoring program is designed to:
- Monitor changes in the temperature of the water body to assess changes in the watershed conditions. Reduction in temperature over summer means condition has improved.
- To check the flow of water to assess any change. As the increase in flow during the summer time is indicative of improvement.
- Decrease in turbidity overtime is a symbol of improved conditions.
- Monitoring of biological and physical factors is an indicator of conditions of the upstream. The evaluation and monitoring team studies the channel morphology, water chemistry, habitat, plants and micro organisms, and photographs of the surrounding areas.
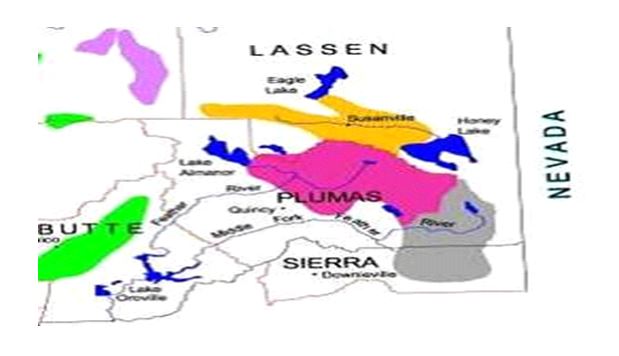
Map from the Northern District Department of Water Resources http://www.nd.water.ca.gov/PPAs/Watermasters/ServiceAreas/index.cfm
The above map shows the water master program established to reserve water rights. This program ensures that there is no wastage of water. They are responsible for the diversions in their area. They check them regularly to keep it adjusted. Each colored piece of land shows the water master working for specific highlighted areas.
As most of the residents of the area are raising cattle, or growing grass for pastures or alfalfa hay, so there is very little or no usage of pesticides in the area, thus making monitoring and evaluating easy and reasonably effective in the area. As the only major crop in the area was alfalfa hay, there were only a few mild pesticides used for its growth and proper maintenance. A herbicide by the name of Gramoxone is used in the area.
The locals of the area made their own organization by the name of Plumas Watershed Organization. It was formed in 2003, by Plumas County Flood Control District and 27 water project contractors. Its main aim was to:
- Identify erosion sources.
- Bring public and private landowners to one forum.
- Gather ways to prevent erosion and implement them.
It completed about 90 of its projects and treated about 3000 miles of the area from erosion.
Sierra Valley receives the heaviest snowfall in January. So the most precipitation received is in winters.
Water temperature has been identified as the water quality assurance by the Central Valley Regional Water Quality Control Board. For water quality assurance, the water levels and temperatures were analyzed at 8 monitoring stations. 2004 – 2009 precipitation is shown in the chart below. Maintenance of the water temperatures is done to ensure the water quality.
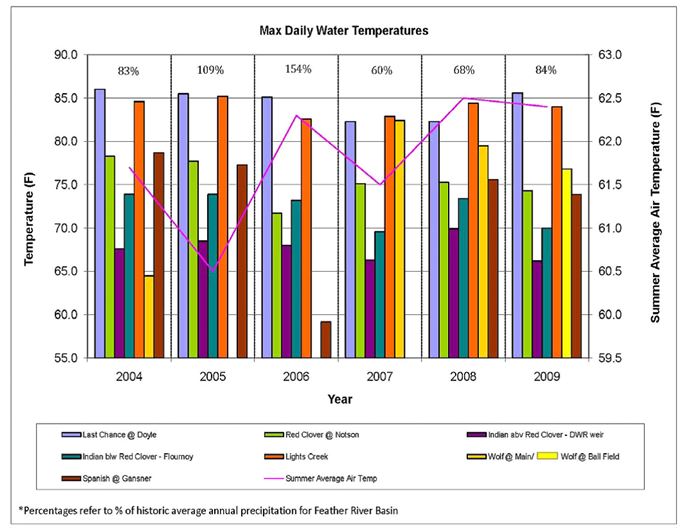
Maximum daily water temperature recorded from 2004 – 2009.
Precipitation/ Stream Flows
The ground water path is really not understandable as it is. It is probably drained into the fractures of the bedrock. Precipitation was a main source of water level maintenance in the area. Snow fall and rainfall keep the balance of water even. The water that falls on the rocks is either washed over the rocks or is sucked in by the fractures to reach the underground reservoir. The snow from the Upper sides of the River melts down to reach the lower parts to maintain the balance. Creek after Creek the water flows to different levels to finally reach the main water body. The chart below shows the water flow in Red Clover Creek at Notson Bridge during the time period of 2002 to 2009 water years.
The Sierra Valley receives the most precipitation during the winter that is about 77% of the total received throughout the year. Little Last Chance Creek, Smithneck Creek, Cold Stream, Miller Creek and Turner Creek contribute to the watershed area taken over by the Middle Fork of Feather River. Here the water enters the Valley from the Last Chance Creek and leaves at Portola. Similarly the Grizzly Creek enters the Valley from the west. The average flow at Portola between 1958 and 1980 was 19,450 acre per year.
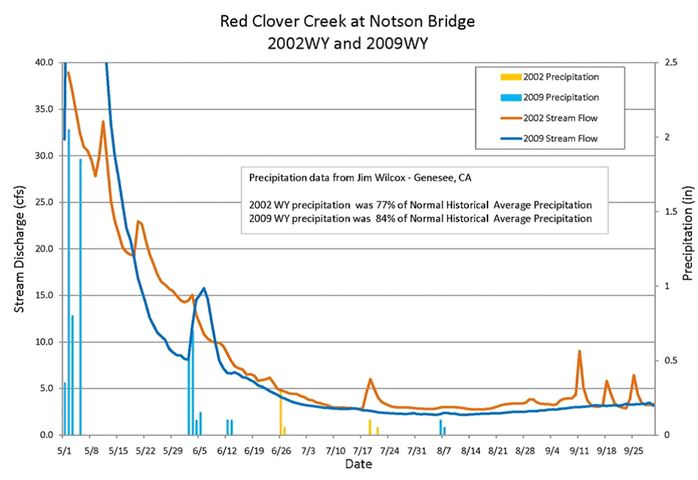
Spring recession stream flows in 2002WY and 2009WY at Notson Bridge
Water Rights
The Sierra and Plumas counties were given their water rights in 1940. Under these were established irrigation districts that controlled and adjusted the flow of water towards the two counties.
- Sierra Valley Groundwater Management District.
- Sierra Valley Water Company.
- Little Last Chance Irrigation district.
These and other sources of water that were drilled were bringing water to the vallies without any violation. But the drilling of wells lowered the water levels of the area. These managements helped establish proper usage of water for the Counties. This made the usage legal and monitoring was easy as well.
The Feather River Watershed Irrigated Lands Prop 50 Project is a program that helps develop discharge or drainage paths for the used water from the agricultural land. Through this program the authorities interact with the landowners within the Watershed who would respond to the Central Valley Regional Water Quality Control Board to address the water quality issues. In a survey conducted in 2006, it was concluded that there was little chemical or fertilizer usage in the Feather River Watershed area. Also the surface water was mainly used for the irrigation purposes and as drinking water for the livestock.
Drainage
Spanish Creek and Greenhorn Creek, the two main watercourses, take the water downstream to Indian Creek and then merge with the North Fork of the Feather river. This also prevents flooding in the area. There is also a network of perennial tributaries in the rea that drains into the Spanish Creek abd Greenhorn Creek. The valley previously served as a floodplain. But because of the incision of the channels that occurred overtime due to water movement, floodwater hardly ever surfaces.
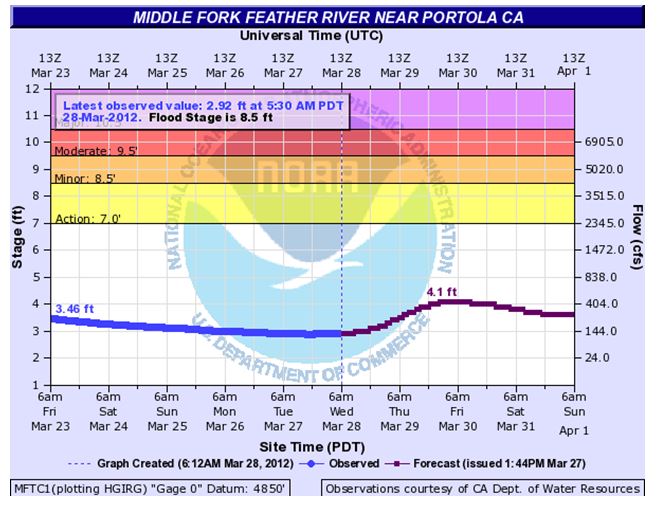
Sierra Institute for community and Environment, 2010 – 2011
Native Americans lived in the main valleys of the Feather River. When the whites arrived, the Indians were thrown to a side and White people were made the main residents of the country. The Indians that lived in the Lake Almanor area were forced to move to Sierra County, and then moved even farther to the Indian Valley. During the harvest time they would go to the Sierra Valley to harvest hay. The demography of the area changed due to the constant movement of water and changing settlements of the people within the Feather River Watershed.
As the time passed the farming and cattle grazing was accompanied by industries and the growing residential demands.
In Plumas County, six waste water treatment plants were built for the soul purpose of not throwing the water into the main stream. The traditional plants were replaced by newer plants at Gold Mountain and Grizzly Ranch etc. this water is treated and then used on land that is within the development area. In Quincy, the treated water is released into the Spanish Creek. Sierra releases its treated water into the Smithneck Creek. These facilities work with the permission of the Regional Water Quality Control Board.
Restoration Program
According to the plan of the program, the basic aim was to store winter and spring precipitation. Under the program, water and air temperatures were recorded every 15 minutes at the monitoring stations at Red Clover Creek and Last Chance Creek and many other monitoring stations. These are then stored and then calculated. There are weather stations and flow stations that continuously record the water incoming and outgoing to ensure a balance in the temperature and level of the water.
Conclusion
Such programs as mentioned above can make the even and maintained flow of the water in the Feather River Watersheds. Weather it be the upper, middle or the smaller watersheds, the temperature and water levels maintained can bring even flow of water to the surrounding area. This will also make sure that the surrounding Counties will not have any problems regarding their water supplies in future. The settlements and their activities had initially damaged the upkeep and the maintenance of the natural resources of the Feather River. Initially it was used, and then people started to misuse it. The Counties underwent major changes and learning processes to finally bring the misuse to a stop. The irrigation system that had no harm on the watershed was restored and monitoring system was established to ensure the maintenance of the natural beauty as well as the upkeep and proper usage of the water. Industries had brought the bolting change and stop to the maintenance, but man has a mind of its own. To keep the sources intact for the future generations to enjoy, monitoring and evaluation system kept the temperatures and level of the watershed to an extent to keep the resource sourceful for the generations to come.
References
California Department of Water Resources (DWR): http://www.water.ca.gov
Feather River Watershed Management Strategy, 1/1/2004: http://www.montereyamendments.water.ca.gov/doc/FeatherRiverStrategy.pdf
Feather River Watershed Management Strategy: http://www.montereyamendmants. Wter.ca.gov.
Integrated Regional Water Management Plan: http://www.countyofplumas.com/publicworks/watershed/IRWMP_0632005.pdf.
National Pollutant Discharge Elimination System (NPDES): http://cfpub.epa.gov/npdes/index.ctm
Sierra Valley Watershed Assessment http://www.sierravalleyrcd.org/nodes/resources/documents/final_sierraval leywaterhsedassessment.pdf
State Water Resources Control Board: http://www.waterboards.ca.gov
United States Geological Survey (USGS): http://www.usgs.gov
Feather River CRM (FR CRM): http://www.feather-river-crm.org/
Feather River CRM. Organization Profile. Fact Sheet #1, January 1997. http://www.feather-river-crm.org/factsheets/fact1.htm.
Plumas County Flood Control and Water Conservation District, California Department of Water Resources, State Water Project Contractors. Plumas Watershed Forum Annual Report. Plumas County, CA, 2006.
Plumas County Historical Society. Plumas Memories. Pub. #26. “Ropes and Wires in Indian Valley.” Quincy, CA, 1967.

Time is precious
don’t waste it!

Plagiarism-free
guarantee

Privacy
guarantee

Secure
checkout

Money back
guarantee


