 All papers examples
Disciplines

- MLA
- APA
- Master's
- Undergraduate
- High School
- PhD
- Harvard
- Biology
- Art
- Drama
- Movies
- Theatre
- Painting
- Music
- Architecture
- Dance
- Design
- History
- American History
- Asian History
- Literature
- Antique Literature
- American Literature
- Asian Literature
- Classic English Literature
- World Literature
- Creative Writing
- English
- Linguistics
- Law
- Criminal Justice
- Legal Issues
- Ethics
- Philosophy
- Religion
- Theology
- Anthropology
- Archaeology
- Economics
- Tourism
- Political Science
- World Affairs
- Psychology
- Sociology
- African-American Studies
- East European Studies
- Latin-American Studies
- Native-American Studies
- West European Studies
- Family and Consumer Science
- Social Issues
- Women and Gender Studies
- Social Work
- Natural Sciences
- Anatomy
- Zoology
- Ecology
- Chemistry
- Pharmacology
- Earth science
- Geography
- Geology
- Astronomy
- Physics
- Agriculture
- Agricultural Studies
- Computer Science
- Internet
- IT Management
- Web Design
- Mathematics
- Business
- Accounting
- Finance
- Investments
- Logistics
- Trade
- Management
- Marketing
- Engineering and Technology
- Engineering
- Technology
- Aeronautics
- Aviation
- Medicine and Health
- Alternative Medicine
- Healthcare
- Nursing
- Nutrition
- Communications and Media
- Advertising
- Communication Strategies
- Journalism
- Public Relations
- Education
- Educational Theories
- Pedagogy
- Teacher's Career
- Statistics
- Chicago/Turabian
- Nature
- Company Analysis
- Sport
- Paintings
- E-commerce
- Holocaust
- Education Theories
- Fashion
- Shakespeare
- Canadian Studies
- Science
- Food Safety
- Relation of Global Warming and Extreme Weather Condition
Paper Types

- Movie Review
- Essay
- Admission Essay
- Annotated Bibliography
- Application Essay
- Article Critique
- Article Review
- Article Writing
- Assessment
- Book Review
- Business Plan
- Business Proposal
- Capstone Project
- Case Study
- Coursework
- Cover Letter
- Creative Essay
- Dissertation
- Dissertation - Abstract
- Dissertation - Conclusion
- Dissertation - Discussion
- Dissertation - Hypothesis
- Dissertation - Introduction
- Dissertation - Literature
- Dissertation - Methodology
- Dissertation - Results
- GCSE Coursework
- Grant Proposal
- Admission Essay
- Annotated Bibliography
- Application Essay
- Article
- Article Critique
- Article Review
- Article Writing
- Assessment
- Book Review
- Business Plan
- Business Proposal
- Capstone Project
- Case Study
- Coursework
- Cover Letter
- Creative Essay
- Dissertation
- Dissertation - Abstract
- Dissertation - Conclusion
- Dissertation - Discussion
- Dissertation - Hypothesis
- Dissertation - Introduction
- Dissertation - Literature
- Dissertation - Methodology
- Dissertation - Results
- Essay
- GCSE Coursework
- Grant Proposal
- Interview
- Lab Report
- Literature Review
- Marketing Plan
- Math Problem
- Movie Analysis
- Movie Review
- Multiple Choice Quiz
- Online Quiz
- Outline
- Personal Statement
- Poem
- Power Point Presentation
- Power Point Presentation With Speaker Notes
- Questionnaire
- Quiz
- Reaction Paper
- Research Paper
- Research Proposal
- Resume
- Speech
- Statistics problem
- SWOT analysis
- Term Paper
- Thesis Paper
- Accounting
- Advertising
- Aeronautics
- African-American Studies
- Agricultural Studies
- Agriculture
- Alternative Medicine
- American History
- American Literature
- Anatomy
- Anthropology
- Antique Literature
- APA
- Archaeology
- Architecture
- Art
- Asian History
- Asian Literature
- Astronomy
- Aviation
- Biology
- Business
- Canadian Studies
- Chemistry
- Chicago/Turabian
- Classic English Literature
- Communication Strategies
- Communications and Media
- Company Analysis
- Computer Science
- Creative Writing
- Criminal Justice
- Dance
- Design
- Drama
- E-commerce
- Earth science
- East European Studies
- Ecology
- Economics
- Education
- Education Theories
- Educational Theories
- Engineering
- Engineering and Technology
- English
- Ethics
- Family and Consumer Science
- Fashion
- Finance
- Food Safety
- Geography
- Geology
- Harvard
- Healthcare
- High School
- History
- Holocaust
- Internet
- Investments
- IT Management
- Journalism
- Latin-American Studies
- Law
- Legal Issues
- Linguistics
- Literature
- Logistics
- Management
- Marketing
- Master's
- Mathematics
- Medicine and Health
- MLA
- Movies
- Music
- Native-American Studies
- Natural Sciences
- Nature
- Nursing
- Nutrition
- Painting
- Paintings
- Pedagogy
- Pharmacology
- PhD
- Philosophy
- Physics
- Political Science
- Psychology
- Public Relations
- Relation of Global Warming and Extreme Weather Condition
- Religion
- Science
- Shakespeare
- Social Issues
- Social Work
- Sociology
- Sport
- Statistics
- Teacher's Career
- Technology
- Theatre
- Theology
- Tourism
- Trade
- Undergraduate
- Web Design
- West European Studies
- Women and Gender Studies
- World Affairs
- World Literature
- Zoology
Aerobic and Anaerobic Respiration, Lab Report Example
Hire a Writer for Custom Lab Report
Use 10% Off Discount: "custom10" in 1 Click 👇
You are free to use it as an inspiration or a source for your own work.

Table 1.Activators and inhibitors of respiration
| Tube | 5 min | 10 min | 15 min | 20 min | 25 min |
| 1 (glucose) | 0.0 mL | 0.2 mL | 2.0 mL | 4.2 mL | 5.0 mL |
| 2 (glucose + MgSO4) | 0.0 mL | 0.7 mL | 3.3 mL | 5.0 mL | – |
| 3 (glucose + pyruvate) | 0.0 mL | 1.0 mL | 3.5 mL | 5.0 mL | – |
| 4 (glucose + ethanol) | 0.0 mL | 0.6 mL | 2.2 mL | 3.8 mL | 5.0 mL |

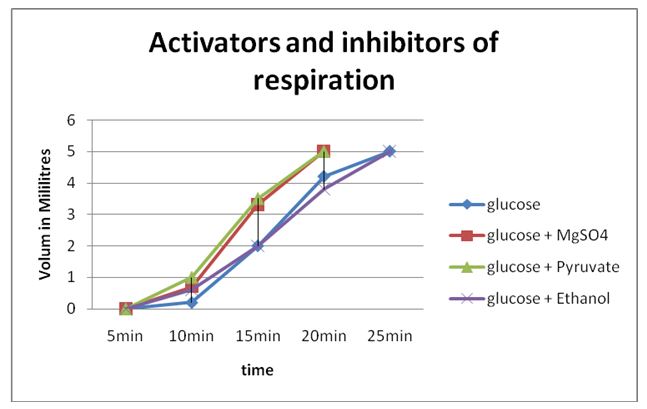
Figure2: Activators and inhibitors of respiration
The experiment examines how the speed of fermentation is determined by the nature of substrate, and activators and inhibitors. The substances used were Pyruvate, ethanol, glucose and a combination of yeast with MgSO4. At five minutes period we documented the volume of gas emit in each fermentation pipe. The results displayed that Pyruvate is an catalyst of fermentation process. However, our outcomes did not sustain the forecasting that MgSO4 is a catalyst of fermentation. This possibly will be because of experimental inaccuracy, for instance the fermentation pipe not being uncontaminated, or the glucose being put in at a different time. Our outcomes showed that as fermentation continued and ethanol concentrations go up, the speed of fermentation came down. Between five to ten minutes, a quick rise in fermentation was noted, after that as the ethanol concentration increased, it began to level off.
Explanation: Enzymes increase the rate of chemical reactions. Pyruvate is a catalyst. It works by lowering the activation energy and in turn increases the rate of reaction. Inhibitors are molecules that decrease enzyme activity. Inhibitors decrease the rate of a reaction as they make the enzyme present fail to play its role. Ethanol is an inhibitor as it decreased the rate of fermentation as its level rose.
Table 2. Temperature and Respiration Rate
| Tube | 5 min | 10 min | 15 min | 20 min | 25 min |
| 1 (10?C) | 0.0 mL | 0.05 mL | 0.4 mL | 1.2 mL | 1.7 mL |
| 2 (20?C) | 0.0 mL | 0.05 mL | 0.8 mL | 1.7 mL | 2.9 mL |
| 3 (30?C) | 0.1 mL | 3.2 mL | 5.0 mL | – | – |
| 4 (40?C) | 2.5 mL | 5.0 mL | – | – | – |

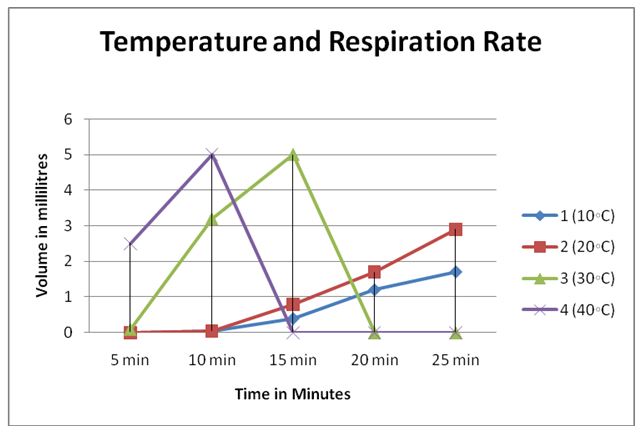
Firgure2: Temperature and Respiration Rate
The second experiment studied the connection between respiration rate and temperature. We mixed yeast independently in four fermentation pipes with four glucose mixtures that had been measured in four special temperatures. We then noted that volume of carbon dioxide generated in each fermentation pipe at five minutes intervals. We examined the speed of metabolism by evaluating the amount of carbon dioxide generated in milliliters per minute. The results displayed that the speed of metabolism increases with rise in temperature. The connection between metabolism and temperature is affirmative. As temperature raised, the metabolic rate raised. The disparity in rate between the 10 degrees Celsius and the 20 degrees Celsius tubes was not the same to the difference in change between the 30 degrees Celsius and the 40 degrees Celsius tubes. The relationship seemed exponential. Temperatures could slow down or stop enzymes, which affect metabolic rates. Reactions are therefore slower in lower temperatures.
Explanation: As temperatures increase, molecules have more motion and activity making the rate of respiration to increase. Lower temperatures make molecule have less motion and activity decreasing the rate of respiration.
Table 3. Oxygen Consumption during Aerobic Respiration
| Sample | 1 min | 2 min | 3 min | 4 min | 5 min |
| germinating beans | 0.0 mL | 0.0 mL | 0.0 mL | 0.1 mL | 0.15 mL |
| dry beans | 0.0mL | 0.0mL | 0.0mL | 0.0mL | 0.0mL |
| cotton control | 0.0 mL | 0.0 mL | 0.0 mL | 0.0 mL | 0.0 mL |
| Sample | 6 min | 7 min | 8 min | 9 min | 10 min |
| germinating beans | 0.18mL | 0.20mL | 0.23mL | 0.26mL | 0.29mL |
| dry beans | 0.0 mL | 0.0 mL | 0.0 mL | 0.0 mL | 0.0 mL |
| cotton control | 0.0 mL | 0.0 mL | 0.0 mL | 0.0 mL | 0.0 mL |

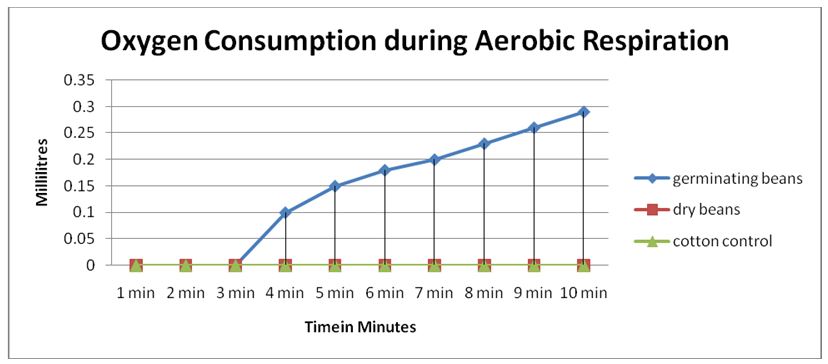
Figure5: Oxygen Consumption during Aerobic Respiration
In this experiment, we observed aerobic respiration by observing the quantity of oxygen consumed in germinating beans. We placed germinated beans, frozen beans and plastic beans in different tubes. A cotton ball soaked in KOH was put on top of the beans. We covered all the tubes with aluminium foil and placed them in clamps on a stand with a drop of dye at the edge of the graduated pipette of each tube while monitoring the movement after one minute. The tube with beads did not display any change in volume. We calculated the respiration rate of the germinated and the frozen beans by subtracting the weight of the beads. The germinated beans respired faster than the frozen beans.
Explanation: Freezing reduces the amount of oxygen that the frozen beans use up. The presence of low oxygen content leads to greater respiration rates.
Table 4.Production of CO2Titration Volumes
| Beaker | Titrated NaOH volume (mL) | mL NaOH per mL of organism |
| 1. control | 1.7 | not applicable |
| 2. fish | 4.0 | 2.3 |
| 3. Elodea | 2.6 | 0.9 |
In this experiment, we used the PH indictor, phenolphthalein, and titration process to measure the amount of carbon dioxide used during respiration by making observations on the change in PH over time. The three beakers had water adjusted to PH 6.9. One beaker had fish, the second beaker had eloder sprig, the third beaker had only water, and it acted as the control of the experiment. All the beakers were covered with paraffin with the beaker having elodea put in the dark to prevent photosynthesis. Plants use up carbon dioxide during photosynthesis and we prevented the alteration in the data containing carbon dioxide released during respiration. After fifteen minutes, we removed fish and elodea from the beakers and placed phenolphthalein to each beaker. We titrated the solution in each beaker to obtain the amount of NaOH used in titration. Subtracting the amount of milliliters used to titrate the control beaker solution from the amount used in the other beakers gives the amount of CO2 produced during respiration. Fish has the higher respiratory rate.
Explanation: Increased activity in fish causes respiratory volumes to increase with the increase in oxygen diffusion rates. In plants the presence of the waxy substance prevents lose and gain of water making the respiration rate slower as compared to fish. Germinating seeds also respire anaerobically releasing carbondioxide.
Conclusion
Aerobic and anaerobic respirations are fundamental metabolic processes that influence the activities of individual cells. Anaerobic respiration produces less energy as compared to anaerobic respiration. Fermentation and cellular respiration facilitate the release of energy in the body of organisms. External energy is essential in all organisms as it assist in maintaining bodily functions and combat entropy.

Stuck with your Lab Report?
Get in touch with one of our experts for instant help!
Tags:

Time is precious
don’t waste it!
writing help!


Plagiarism-free
guarantee

Privacy
guarantee

Secure
checkout

Money back
guarantee

