 All papers examples
Disciplines

- MLA
- APA
- Master's
- Undergraduate
- High School
- PhD
- Harvard
- Biology
- Art
- Drama
- Movies
- Theatre
- Painting
- Music
- Architecture
- Dance
- Design
- History
- American History
- Asian History
- Literature
- Antique Literature
- American Literature
- Asian Literature
- Classic English Literature
- World Literature
- Creative Writing
- English
- Linguistics
- Law
- Criminal Justice
- Legal Issues
- Ethics
- Philosophy
- Religion
- Theology
- Anthropology
- Archaeology
- Economics
- Tourism
- Political Science
- World Affairs
- Psychology
- Sociology
- African-American Studies
- East European Studies
- Latin-American Studies
- Native-American Studies
- West European Studies
- Family and Consumer Science
- Social Issues
- Women and Gender Studies
- Social Work
- Natural Sciences
- Anatomy
- Zoology
- Ecology
- Chemistry
- Pharmacology
- Earth science
- Geography
- Geology
- Astronomy
- Physics
- Agriculture
- Agricultural Studies
- Computer Science
- Internet
- IT Management
- Web Design
- Mathematics
- Business
- Accounting
- Finance
- Investments
- Logistics
- Trade
- Management
- Marketing
- Engineering and Technology
- Engineering
- Technology
- Aeronautics
- Aviation
- Medicine and Health
- Alternative Medicine
- Healthcare
- Nursing
- Nutrition
- Communications and Media
- Advertising
- Communication Strategies
- Journalism
- Public Relations
- Education
- Educational Theories
- Pedagogy
- Teacher's Career
- Statistics
- Chicago/Turabian
- Nature
- Company Analysis
- Sport
- Paintings
- E-commerce
- Holocaust
- Education Theories
- Fashion
- Shakespeare
- Canadian Studies
- Science
- Food Safety
- Relation of Global Warming and Extreme Weather Condition
Paper Types

- Movie Review
- Essay
- Admission Essay
- Annotated Bibliography
- Application Essay
- Article Critique
- Article Review
- Article Writing
- Assessment
- Book Review
- Business Plan
- Business Proposal
- Capstone Project
- Case Study
- Coursework
- Cover Letter
- Creative Essay
- Dissertation
- Dissertation - Abstract
- Dissertation - Conclusion
- Dissertation - Discussion
- Dissertation - Hypothesis
- Dissertation - Introduction
- Dissertation - Literature
- Dissertation - Methodology
- Dissertation - Results
- GCSE Coursework
- Grant Proposal
- Admission Essay
- Annotated Bibliography
- Application Essay
- Article
- Article Critique
- Article Review
- Article Writing
- Assessment
- Book Review
- Business Plan
- Business Proposal
- Capstone Project
- Case Study
- Coursework
- Cover Letter
- Creative Essay
- Dissertation
- Dissertation - Abstract
- Dissertation - Conclusion
- Dissertation - Discussion
- Dissertation - Hypothesis
- Dissertation - Introduction
- Dissertation - Literature
- Dissertation - Methodology
- Dissertation - Results
- Essay
- GCSE Coursework
- Grant Proposal
- Interview
- Lab Report
- Literature Review
- Marketing Plan
- Math Problem
- Movie Analysis
- Movie Review
- Multiple Choice Quiz
- Online Quiz
- Outline
- Personal Statement
- Poem
- Power Point Presentation
- Power Point Presentation With Speaker Notes
- Questionnaire
- Quiz
- Reaction Paper
- Research Paper
- Research Proposal
- Resume
- Speech
- Statistics problem
- SWOT analysis
- Term Paper
- Thesis Paper
- Accounting
- Advertising
- Aeronautics
- African-American Studies
- Agricultural Studies
- Agriculture
- Alternative Medicine
- American History
- American Literature
- Anatomy
- Anthropology
- Antique Literature
- APA
- Archaeology
- Architecture
- Art
- Asian History
- Asian Literature
- Astronomy
- Aviation
- Biology
- Business
- Canadian Studies
- Chemistry
- Chicago/Turabian
- Classic English Literature
- Communication Strategies
- Communications and Media
- Company Analysis
- Computer Science
- Creative Writing
- Criminal Justice
- Dance
- Design
- Drama
- E-commerce
- Earth science
- East European Studies
- Ecology
- Economics
- Education
- Education Theories
- Educational Theories
- Engineering
- Engineering and Technology
- English
- Ethics
- Family and Consumer Science
- Fashion
- Finance
- Food Safety
- Geography
- Geology
- Harvard
- Healthcare
- High School
- History
- Holocaust
- Internet
- Investments
- IT Management
- Journalism
- Latin-American Studies
- Law
- Legal Issues
- Linguistics
- Literature
- Logistics
- Management
- Marketing
- Master's
- Mathematics
- Medicine and Health
- MLA
- Movies
- Music
- Native-American Studies
- Natural Sciences
- Nature
- Nursing
- Nutrition
- Painting
- Paintings
- Pedagogy
- Pharmacology
- PhD
- Philosophy
- Physics
- Political Science
- Psychology
- Public Relations
- Relation of Global Warming and Extreme Weather Condition
- Religion
- Science
- Shakespeare
- Social Issues
- Social Work
- Sociology
- Sport
- Statistics
- Teacher's Career
- Technology
- Theatre
- Theology
- Tourism
- Trade
- Undergraduate
- Web Design
- West European Studies
- Women and Gender Studies
- World Affairs
- World Literature
- Zoology
Combustion of Alcohols, Lab Report Example
Hire a Writer for Custom Lab Report
Use 10% Off Discount: "custom10" in 1 Click 👇
You are free to use it as an inspiration or a source for your own work.

Qualitative Data
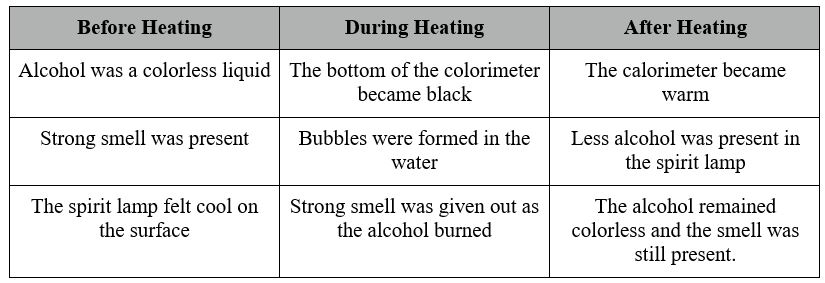
The same qualitative data was collected for all the alcohols.
In the experiment the paper lid was used in order to prevent the water from evaporating from the calorimeter. The lid was constructed from cardboard and attached to the calorimeter with adhesive tape. The hole was made for the thermometer leaving some space for the escapement of the heat.
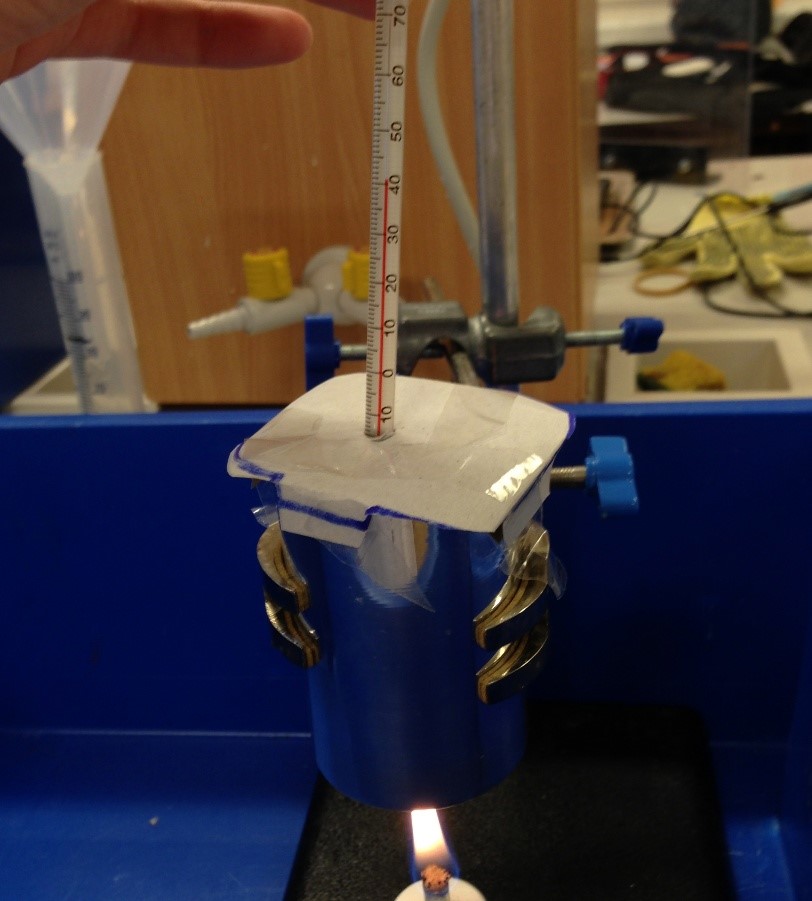
Furthermore, it prevented the exterior surrounding from affecting the results. In addition a plastic container was used to reduce the effect of the surroundings on the experiment by acting as an insulator from wind. This adds on to the accuracy of the processing.
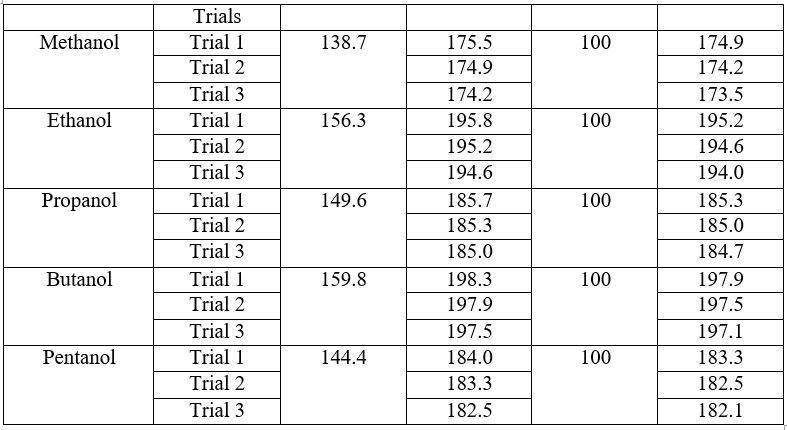
During Heating
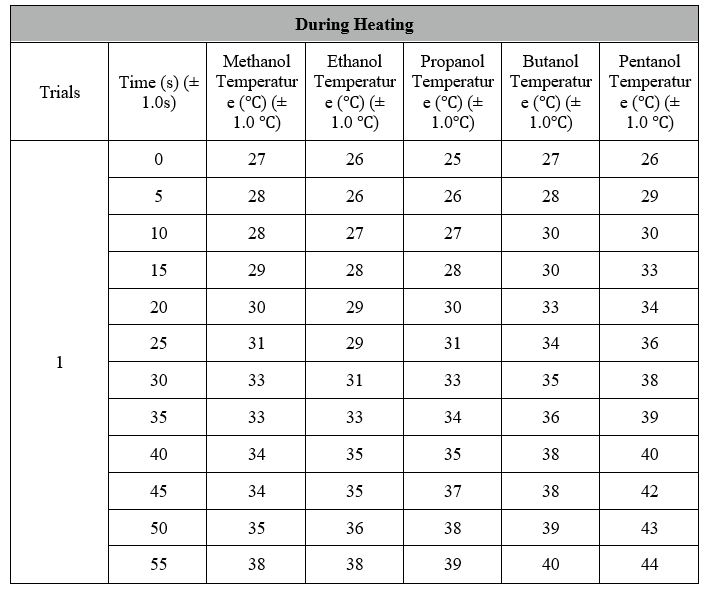
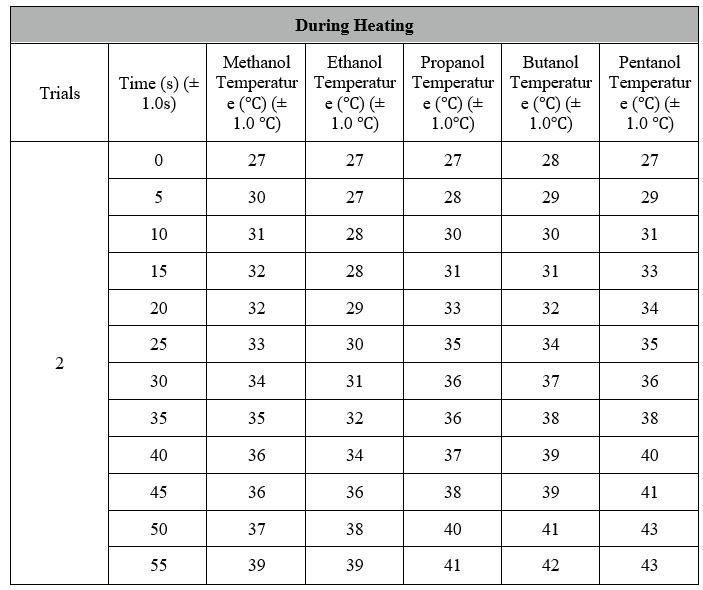
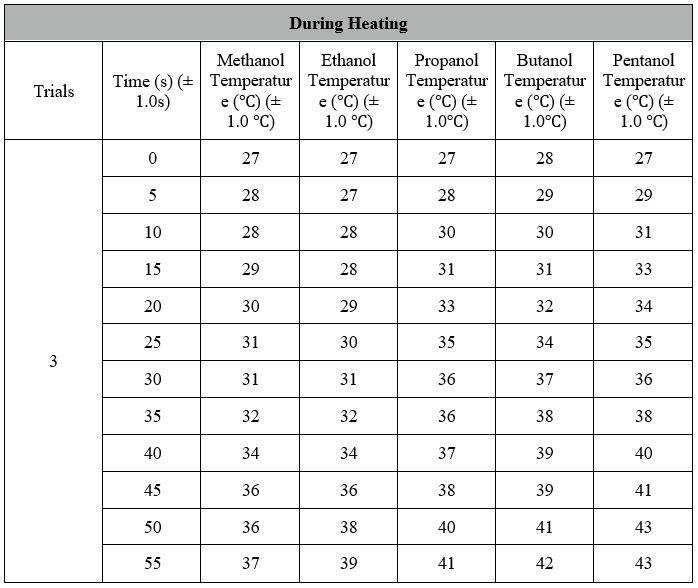
Data Processing:
Enthalpy Change during combustion (?H) = mc?T
Methanol
Volume of water = 100 cm3
Mass of Water (m) = Volume x Density
= 100 cm3 x 1 g/cm3
(m) = 100 g
Temperature before Heating: 27 ?
Temperature after Heating: 38, 39 and 37 degrees Celsius = 38? (Average for 3 Trials)
Total Change in Temperature: 38 ? – 27 ?
(?T) = 11 ?
Specific Heat Capacity of Water = 4.18 J g-1 K-1
Therefore:
Enthalpy Change = 100 g x 4.18 J g -1 K -1 x 11 K
Enthalpy Change = 4.598 kJ (Average for 3 Trials)
Mass of spirit lamp = 138.7 g
Mass of spirit lamp with methanol = 174. 9 + 174.2 + 173. 5 / 3 = 174.2 g (average mass calculated from the 3 Trials)
? Mass of Methanol burnt = (175.5 – 174.9) + (174.9-174.2) + (174-173.5) / 3 = 0.6g
Molar Mass of Methanol = 12.0107 + (1.00794 × 4) + 15.9994 = 32.04 g/mol (2 decimal places)
? Moles of Methanol burnt = Mass of Methanol
Molar Mass of Methanol
= 0.6g
32.04 g/mol
= 0.0187 mol (rounded to three significant figures)
? Standard Enthalpy of Combustion of Methanol
= Enthalpy Change during combustion (?H)
Number of Moles of Methanol
= 4.598 kJ
0.0187 mol
= 245.88 kJ/mol (rounded to 2 decimal places)
Ethanol
Volume of water = 100 cm3
Mass of Water (m) = Volume x Density
= 100 cm3 x 1 g/cm3
= 100 g
Temperature before Heating: 26 + 27 + 27 / 3 = 26.67 ? (Average for 3 Trials)
Temperature after Heating: 38 + 39 + 39 / 3 = 38.67 ? (Average for 3 Trials)
Total Change in Temperature: 38.67 ? – 26.67 ? = 12 ?
Specific Heat Capacity of Water = 4.18 J g -1 K -1
Therefore:
Enthalpy Change = 100 g x 4.18 J g -1 K -1 x 12 K
Enthalpy Change = 5.016 kJ (Average for 3 Trials)
Mass of spirit lamp = 156.3 g
Mass of spirit lamp with ethanol = 195.2 + 194.6 + 194.0 / 3 = 194.6 g (average mass calculated from the 3 Trials)
? Mass of Ethanol burnt = (195.8-195.2) + (195.2-194.6) + (194.6-194) / 3 = 0.6g
Molar Mass of Ethanol = 46.07g/mol (2 decimal places)
? Moles of Ethanol burnt = Mass of Ethanol
Number of Moles of Ethanol
= 0.6g
46.07g/mol (2 decimal places)
= 0.013 mol (rounded to three significant figures)
? Standard Enthalpy of Combustion of Ethanol
= Enthalpy Change during combustion (?H)
Number of Moles of Ethanol
= 5.016 kJ
0.013mol
= 385.85 kJ/mol (rounded to 2 decimal places)
The same procedures were made for the other 3 alcohols to calculate the standard enthalpy and the results were put into the table on the next page.

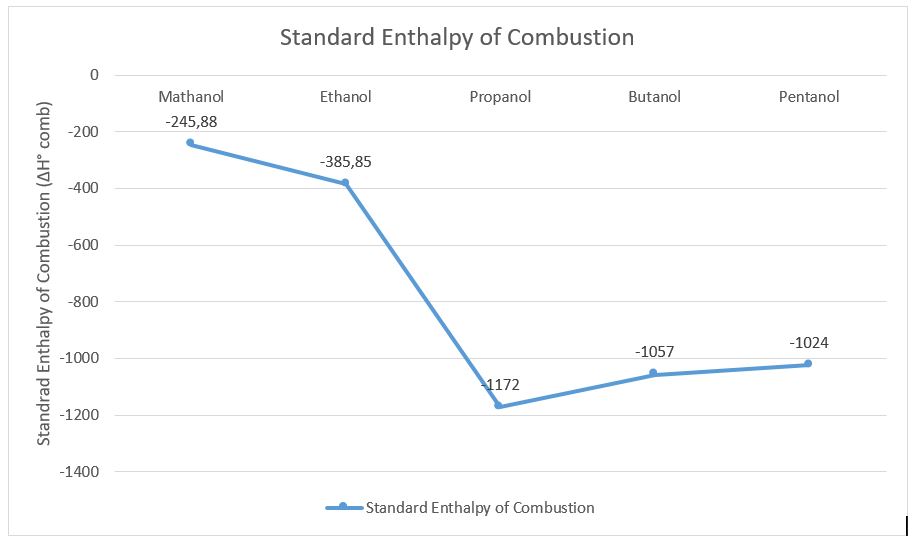
The graph above demonstrates the results of the standard enthalpy of combustion of the alcohols investigated in this experiment.
Published Results
Published results are used to compare the results with the literature results which have been proven.
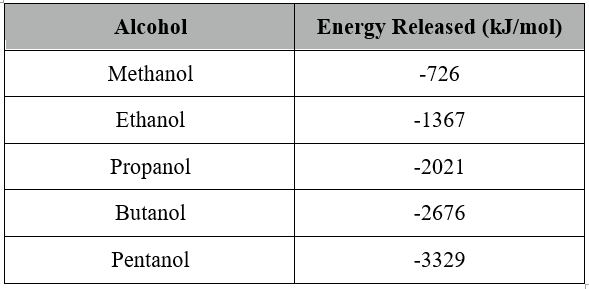
(CreativeChemistry.org, 2011)
When the literature results and obtained results from this experiment are plotted on the same graph it can be seen that the results have a large error rate.
The published results and the graph on the previous page were used to calculate the percentage error.
Methanol (the values of Standard Enthalpy of Combustion (?H ?comb) are positive for calculations)
Literature Value gathered from (CreativeChemistry.org, 2011)
= 726 kJ/mol
Value obtained from the experiment: 24.59 kJ/mol
Error Value = 726-24.59 = 701.41 kJ/mol
Percentage Error = Error x 100%
Literature Value
= 96.6% (Rounded to one decimal place)
The same procedures were made for the other 4 alcohols to calculate the percentage errors and recorded in the table below.
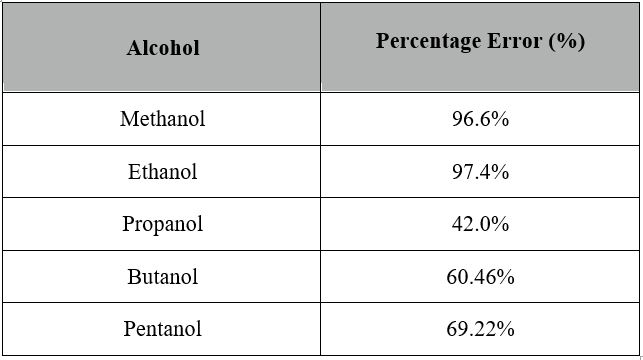
Although the percentage errors are relatively high, especially for Methanol and Ethanol, the results obtained are adequate. The random and systematic errors could all apply to the high percentage errors.
Error Propagation:
Methanol:
Uncertainty in the mass balance = 0.001 g
Mass of methanol burnt = 0.6g ± 0.003 Percentage Uncertainty = 0.003g x 100% / 0.6g = 0.5%
Uncertainty in the thermometer = 0.5?
Temperature Difference = 11 ? ± 1.5 ? Percentage Uncertainty = 1.5 ? x 100% = 13.64 %( rounded to 2 significant figures)
Uncertainty in the measuring of the volume = 0.5cm3
Volume of water = 100cm3 = 0.5%
Total uncertainty = 0.5% + 13.64% + 0.5% = 14.64%
Uncertainty in kJ/mol = 14.64% of 24.59 kJ/mol = ± 3.60
The standard enthalpy of combustion of methanol including uncertainty is:
24.59 kJ/mol ± 3.60 kJ/mol
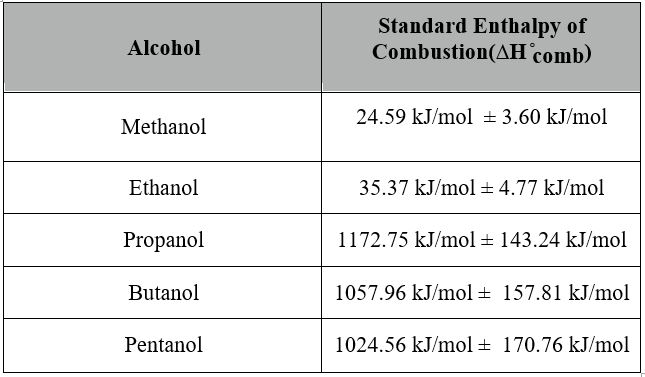
The same procedures were made for the other 4 alcohols to calculate the standard enthalpy of combustion of alcohols including uncertainties and the results were put into the table on the next page.
Conclusion:
The results which were obtained were unexpected as the theoretical results show a linear relationship between the increasing number of carbons in the alcohol and increasing standard enthalpy of combustion. On the other hand the results from this experiment show a nonlinear relationship with the anomaly in the standard enthalpy of combustion for Pentanol which is surprisingly higher than the results for Butanol and Propanol.
The contrast between the theoretical values and observed values shown on the graph on page 11 of this report. The theoretical values emphasize the linear relationship between the enthalpy change and the increasing number of carbons in the alcohol. As a result it can be seen that methanol requires least energy to be burnt and therefore it acts as a best source of fuel out of the 5 alcohols investigated in this experiment. The results obtained supports this statement as methanol has the lowest Standard Enthalpy of Combustion of the value 24.59 kJ/mol ± 3.60 kJ/mol. On the other hand according to the theoretical values the least efficient source of fuel out of the 5 alcohols is, Pentanol. However, the results show that the least efficient source of fuel is Propanol with the highest Standard Enthalpy of Combustion of the value 1172.75 kJ/mol ± 143.24 kJ/mol. The percentage errors were calculated to see the difference between the literature results and the results obtained, furthermore, even though the percentage errors were high it can be said that the results were satisfactory and the experiment was carried out carefully. The high error propagations calculated as well as high percentage errors could be recorded as a result of random and systematic errors, these errors are unpredictable and inevitable
There is a huge disparity between the published results and the results obtained from the experiment. This can be attributed to the weaknesses and limitations that are associated with this experiment. The major weakness that is associated with the experiment is human error. As a result of errors in the collection of data, there a significant disparity in the results obtained from the published results. Also, instrumental errors or errors associated with the uncertainty of instruments is a significant factor in this huge disparity. The calorimeter becomes warmer after heating and as a result the following trials are affected by the increased temperature of the calorimeter which could affect the rate at which the water becomes hotter.
Furthermore, the same cardboard lid was used for all the trials, and by the end it might have been less efficient in preventing the external environment from affecting the experiment, as a result the last trials are not as accurate as the previous ones. The purity of distilled water was used from different containers is questionable. This also adds on the inaccuracy, this could affect the content of the water and therefore result in the altered data collected.
The plastic container acted as a shield for the experiment from the exterior environment, it also prevented the wind from affecting the spirit lamp. These weaknesses also represent the limitations of the experiment. The quality of the instruments and the procedure employed in conducting the experiments compound the uncertainties and impurities that are in the experiment.
Evaluation:
It is evident that this experiment could be carried out more accurately and efficiently due to the high percentage error. Most of the errors and inaccuracies are preventable and can be easily fixed by doing the following things:
Use a plastic cup which accurately closes the calorimeter therefore preventing the heat from escaping and preventing the exterior environment from affecting the experiment, such as temperature and the wind.
The metal calorimeter (copper) absorbed a large amount of heat from the experiment and the data was not collected. In the future the temperature of the calorimeter should be recorded and included in the error propagation calculations.
Many of the human errors can be fixed by using the computer data collector which establishes the accurate measurements of the temperature change against time. Furthermore, the distilled water and the measurement equipment should be used carefully and accurately.
Some systematic errors can be prevented easily by:
Make sure the thermometer is stirred to make sure the accurate temperature is collected. Also make sure that the thermometer does no touch the bottom of the calorimeter to avoid the false measurements.
The spirit lamp should be distinguished as soon as possible to avoid any loss of alcohol.
Investigate other alcohols and carry out more trials to obtain varied and further accurate results.
References
CreativeChemistry.org. (2011). Chemistry Lab Report. Retrieved October 16, 2013, from http://www.creative-chemistry.org.uk/gcse/documents/Module7/N-m07-24.pdf
Saunders, N. (2000). Chemistry Lab Report. Retrieved October 16, 2013, from http://www.creative-chemistry.org.uk/gcse/documents/Module7/N-m07-24.pdf

Stuck with your Lab Report?
Get in touch with one of our experts for instant help!
Tags:

Time is precious
don’t waste it!
writing help!


Plagiarism-free
guarantee

Privacy
guarantee

Secure
checkout

Money back
guarantee

