 All papers examples
Disciplines

- MLA
- APA
- Master's
- Undergraduate
- High School
- PhD
- Harvard
- Biology
- Art
- Drama
- Movies
- Theatre
- Painting
- Music
- Architecture
- Dance
- Design
- History
- American History
- Asian History
- Literature
- Antique Literature
- American Literature
- Asian Literature
- Classic English Literature
- World Literature
- Creative Writing
- English
- Linguistics
- Law
- Criminal Justice
- Legal Issues
- Ethics
- Philosophy
- Religion
- Theology
- Anthropology
- Archaeology
- Economics
- Tourism
- Political Science
- World Affairs
- Psychology
- Sociology
- African-American Studies
- East European Studies
- Latin-American Studies
- Native-American Studies
- West European Studies
- Family and Consumer Science
- Social Issues
- Women and Gender Studies
- Social Work
- Natural Sciences
- Anatomy
- Zoology
- Ecology
- Chemistry
- Pharmacology
- Earth science
- Geography
- Geology
- Astronomy
- Physics
- Agriculture
- Agricultural Studies
- Computer Science
- Internet
- IT Management
- Web Design
- Mathematics
- Business
- Accounting
- Finance
- Investments
- Logistics
- Trade
- Management
- Marketing
- Engineering and Technology
- Engineering
- Technology
- Aeronautics
- Aviation
- Medicine and Health
- Alternative Medicine
- Healthcare
- Nursing
- Nutrition
- Communications and Media
- Advertising
- Communication Strategies
- Journalism
- Public Relations
- Education
- Educational Theories
- Pedagogy
- Teacher's Career
- Statistics
- Chicago/Turabian
- Nature
- Company Analysis
- Sport
- Paintings
- E-commerce
- Holocaust
- Education Theories
- Fashion
- Shakespeare
- Canadian Studies
- Science
- Food Safety
- Relation of Global Warming and Extreme Weather Condition
Paper Types

- Movie Review
- Essay
- Admission Essay
- Annotated Bibliography
- Application Essay
- Article Critique
- Article Review
- Article Writing
- Assessment
- Book Review
- Business Plan
- Business Proposal
- Capstone Project
- Case Study
- Coursework
- Cover Letter
- Creative Essay
- Dissertation
- Dissertation - Abstract
- Dissertation - Conclusion
- Dissertation - Discussion
- Dissertation - Hypothesis
- Dissertation - Introduction
- Dissertation - Literature
- Dissertation - Methodology
- Dissertation - Results
- GCSE Coursework
- Grant Proposal
- Admission Essay
- Annotated Bibliography
- Application Essay
- Article
- Article Critique
- Article Review
- Article Writing
- Assessment
- Book Review
- Business Plan
- Business Proposal
- Capstone Project
- Case Study
- Coursework
- Cover Letter
- Creative Essay
- Dissertation
- Dissertation - Abstract
- Dissertation - Conclusion
- Dissertation - Discussion
- Dissertation - Hypothesis
- Dissertation - Introduction
- Dissertation - Literature
- Dissertation - Methodology
- Dissertation - Results
- Essay
- GCSE Coursework
- Grant Proposal
- Interview
- Lab Report
- Literature Review
- Marketing Plan
- Math Problem
- Movie Analysis
- Movie Review
- Multiple Choice Quiz
- Online Quiz
- Outline
- Personal Statement
- Poem
- Power Point Presentation
- Power Point Presentation With Speaker Notes
- Questionnaire
- Quiz
- Reaction Paper
- Research Paper
- Research Proposal
- Resume
- Speech
- Statistics problem
- SWOT analysis
- Term Paper
- Thesis Paper
- Accounting
- Advertising
- Aeronautics
- African-American Studies
- Agricultural Studies
- Agriculture
- Alternative Medicine
- American History
- American Literature
- Anatomy
- Anthropology
- Antique Literature
- APA
- Archaeology
- Architecture
- Art
- Asian History
- Asian Literature
- Astronomy
- Aviation
- Biology
- Business
- Canadian Studies
- Chemistry
- Chicago/Turabian
- Classic English Literature
- Communication Strategies
- Communications and Media
- Company Analysis
- Computer Science
- Creative Writing
- Criminal Justice
- Dance
- Design
- Drama
- E-commerce
- Earth science
- East European Studies
- Ecology
- Economics
- Education
- Education Theories
- Educational Theories
- Engineering
- Engineering and Technology
- English
- Ethics
- Family and Consumer Science
- Fashion
- Finance
- Food Safety
- Geography
- Geology
- Harvard
- Healthcare
- High School
- History
- Holocaust
- Internet
- Investments
- IT Management
- Journalism
- Latin-American Studies
- Law
- Legal Issues
- Linguistics
- Literature
- Logistics
- Management
- Marketing
- Master's
- Mathematics
- Medicine and Health
- MLA
- Movies
- Music
- Native-American Studies
- Natural Sciences
- Nature
- Nursing
- Nutrition
- Painting
- Paintings
- Pedagogy
- Pharmacology
- PhD
- Philosophy
- Physics
- Political Science
- Psychology
- Public Relations
- Relation of Global Warming and Extreme Weather Condition
- Religion
- Science
- Shakespeare
- Social Issues
- Social Work
- Sociology
- Sport
- Statistics
- Teacher's Career
- Technology
- Theatre
- Theology
- Tourism
- Trade
- Undergraduate
- Web Design
- West European Studies
- Women and Gender Studies
- World Affairs
- World Literature
- Zoology
Errors and Uncertainty, Lab Report Example
Hire a Writer for Custom Lab Report
Use 10% Off Discount: "custom10" in 1 Click 👇
You are free to use it as an inspiration or a source for your own work.

Introduction
In experimental science, there is always some amount of uncertainty. Sometimes this uncertainty is resultant of experimental error. In this experiment researchers investigate the impact and sources of such errors. In essence, there are two types of errors. Systematic errors which are the result of the way the experiment is conducted, and random errors which result from natural conditions measurement. These concepts are explored through a simple beam bending experiment.
Theory
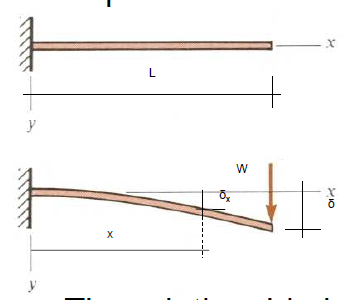
Young’s modulus is a method of calculating the load produced on a bending beam. The following figure illustrates the principle.

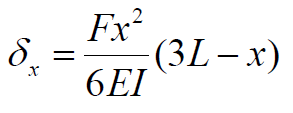
The formula to derive Young’s modulus is:

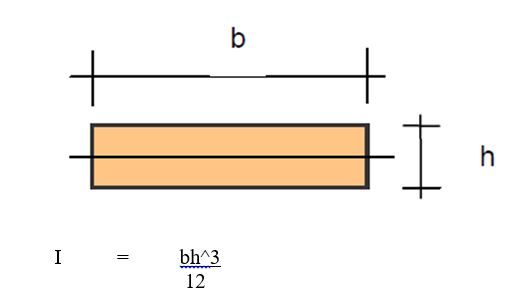
Where, F is the load. X is the distance between the support and deflection. L is the distance from the point of application and the support. E is Young’s modulus, and I is the measures of the cross section of the beam as illustrated below.

In other words, the amount of deflection may be expressed as the length of the beam times itself times the load times the difference between 3 times the length from the point of deflection minus the total length over 6 times Young’s modulus times the width times height cubed. Because E is a known constant we can reasonably assume that one measuring device will demonstrate to be more precise than the other.
Methods
The experiment started with s setup of the apparatus. Once the beam was clamp to a frame, it was ready to receive loads. The moment of deflection is measure simultaneously with as potentiometer and point gauge. Then, critical measurements of the beam were made, and an estimate of error conducted. A prediction of the variation of F produces on the result was made. The gauge and potentiometer were zeroed, and 9 loads were added to the end of the beam to produce the deflection. After each load was added readings from the potentiometer and the gauge were recorded. Then, they were unloaded to ready the apparatus fro the next repetition. A total of six repetitions were conducted. From these data points, statistical analysis will reveal which method of measure is more precise based on standard error. Experimenters predict that the dial will be more precise than the potentiometer.
Results
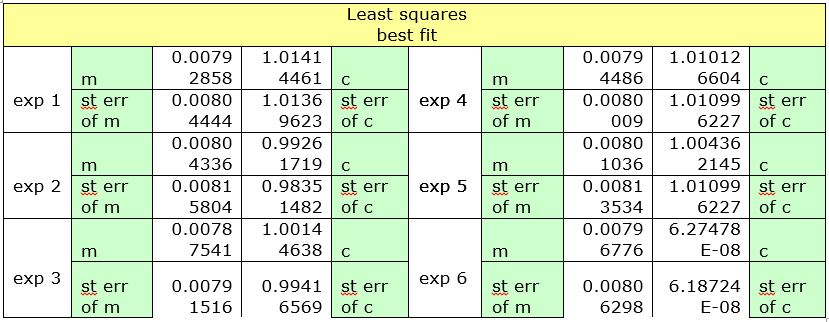
Which data set is most suitable to represent Young’s modulus? The answer may be calculated using the sum of least squares.

While the slope and standard error of the slope are found in each set, we may calculate E.
Calculating the mean of means helps calculate the standard error.

This allows us to estimate the impact of the average impact of the error.
Finally, graphs of the data sets are illustrated.
Discussion
Are the results expected? If not, why not? I did not expect the errors to be so low. It appears the devices are much more precise than I thought. The theoretical results and the experimental results agree both qualitatively and quantitatively. The only real improvement I can think of is to use devices and materials that are newer. This could resduce the error. Also, collecting more data would help. For example, if the entire classe pooled their observations together.
Conclusion
The aim of this experimental was to explore experimental error in a beam deflection test. It was found that near-similar procedures could produce differing results. What we found was basically a linear relationship between the loads and the measures. The average was +/- 27.25 N/m^2. This error may be explained in a number of ways. Tensile strength could vary as the increase temperature produced by bending occurs. Also, the variation in measuring devises and loads could produce a certain amount of error. Also, a perception of the experimenters observing the data is always possible. Nevertheless, the variation is often manageable with the application of statistical principles.

Stuck with your Lab Report?
Get in touch with one of our experts for instant help!

Time is precious
don’t waste it!
writing help!


Plagiarism-free
guarantee

Privacy
guarantee

Secure
checkout

Money back
guarantee

