 All papers examples
Disciplines

- MLA
- APA
- Master's
- Undergraduate
- High School
- PhD
- Harvard
- Biology
- Art
- Drama
- Movies
- Theatre
- Painting
- Music
- Architecture
- Dance
- Design
- History
- American History
- Asian History
- Literature
- Antique Literature
- American Literature
- Asian Literature
- Classic English Literature
- World Literature
- Creative Writing
- English
- Linguistics
- Law
- Criminal Justice
- Legal Issues
- Ethics
- Philosophy
- Religion
- Theology
- Anthropology
- Archaeology
- Economics
- Tourism
- Political Science
- World Affairs
- Psychology
- Sociology
- African-American Studies
- East European Studies
- Latin-American Studies
- Native-American Studies
- West European Studies
- Family and Consumer Science
- Social Issues
- Women and Gender Studies
- Social Work
- Natural Sciences
- Anatomy
- Zoology
- Ecology
- Chemistry
- Pharmacology
- Earth science
- Geography
- Geology
- Astronomy
- Physics
- Agriculture
- Agricultural Studies
- Computer Science
- Internet
- IT Management
- Web Design
- Mathematics
- Business
- Accounting
- Finance
- Investments
- Logistics
- Trade
- Management
- Marketing
- Engineering and Technology
- Engineering
- Technology
- Aeronautics
- Aviation
- Medicine and Health
- Alternative Medicine
- Healthcare
- Nursing
- Nutrition
- Communications and Media
- Advertising
- Communication Strategies
- Journalism
- Public Relations
- Education
- Educational Theories
- Pedagogy
- Teacher's Career
- Statistics
- Chicago/Turabian
- Nature
- Company Analysis
- Sport
- Paintings
- E-commerce
- Holocaust
- Education Theories
- Fashion
- Shakespeare
- Canadian Studies
- Science
- Food Safety
- Relation of Global Warming and Extreme Weather Condition
Paper Types

- Movie Review
- Essay
- Admission Essay
- Annotated Bibliography
- Application Essay
- Article Critique
- Article Review
- Article Writing
- Assessment
- Book Review
- Business Plan
- Business Proposal
- Capstone Project
- Case Study
- Coursework
- Cover Letter
- Creative Essay
- Dissertation
- Dissertation - Abstract
- Dissertation - Conclusion
- Dissertation - Discussion
- Dissertation - Hypothesis
- Dissertation - Introduction
- Dissertation - Literature
- Dissertation - Methodology
- Dissertation - Results
- GCSE Coursework
- Grant Proposal
- Admission Essay
- Annotated Bibliography
- Application Essay
- Article
- Article Critique
- Article Review
- Article Writing
- Assessment
- Book Review
- Business Plan
- Business Proposal
- Capstone Project
- Case Study
- Coursework
- Cover Letter
- Creative Essay
- Dissertation
- Dissertation - Abstract
- Dissertation - Conclusion
- Dissertation - Discussion
- Dissertation - Hypothesis
- Dissertation - Introduction
- Dissertation - Literature
- Dissertation - Methodology
- Dissertation - Results
- Essay
- GCSE Coursework
- Grant Proposal
- Interview
- Lab Report
- Literature Review
- Marketing Plan
- Math Problem
- Movie Analysis
- Movie Review
- Multiple Choice Quiz
- Online Quiz
- Outline
- Personal Statement
- Poem
- Power Point Presentation
- Power Point Presentation With Speaker Notes
- Questionnaire
- Quiz
- Reaction Paper
- Research Paper
- Research Proposal
- Resume
- Speech
- Statistics problem
- SWOT analysis
- Term Paper
- Thesis Paper
- Accounting
- Advertising
- Aeronautics
- African-American Studies
- Agricultural Studies
- Agriculture
- Alternative Medicine
- American History
- American Literature
- Anatomy
- Anthropology
- Antique Literature
- APA
- Archaeology
- Architecture
- Art
- Asian History
- Asian Literature
- Astronomy
- Aviation
- Biology
- Business
- Canadian Studies
- Chemistry
- Chicago/Turabian
- Classic English Literature
- Communication Strategies
- Communications and Media
- Company Analysis
- Computer Science
- Creative Writing
- Criminal Justice
- Dance
- Design
- Drama
- E-commerce
- Earth science
- East European Studies
- Ecology
- Economics
- Education
- Education Theories
- Educational Theories
- Engineering
- Engineering and Technology
- English
- Ethics
- Family and Consumer Science
- Fashion
- Finance
- Food Safety
- Geography
- Geology
- Harvard
- Healthcare
- High School
- History
- Holocaust
- Internet
- Investments
- IT Management
- Journalism
- Latin-American Studies
- Law
- Legal Issues
- Linguistics
- Literature
- Logistics
- Management
- Marketing
- Master's
- Mathematics
- Medicine and Health
- MLA
- Movies
- Music
- Native-American Studies
- Natural Sciences
- Nature
- Nursing
- Nutrition
- Painting
- Paintings
- Pedagogy
- Pharmacology
- PhD
- Philosophy
- Physics
- Political Science
- Psychology
- Public Relations
- Relation of Global Warming and Extreme Weather Condition
- Religion
- Science
- Shakespeare
- Social Issues
- Social Work
- Sociology
- Sport
- Statistics
- Teacher's Career
- Technology
- Theatre
- Theology
- Tourism
- Trade
- Undergraduate
- Web Design
- West European Studies
- Women and Gender Studies
- World Affairs
- World Literature
- Zoology
Fermentation in the Conversion of Juice to Wine, Lab Report Example
Hire a Writer for Custom Lab Report
Use 10% Off Discount: "custom10" in 1 Click 👇
You are free to use it as an inspiration or a source for your own work.

Research Question
How long does it take to ferment juice into wine and what extent of fermentation occurs? To determine how long it takes to ferment juice into wine, grape juice will be incubated with yeast. The juice will be observed for bubbling as an indicator of fermentation.
Background
The process of fermentation involves yeast’s transformation of sugars into ethanol. Humans have harnessed this process to make and enjoy many alcoholic beverages, including beer and wine. Although the formulation of wine appears at first to be a difficult process, it is a natural occurrence and can be mimicked simply. After yeast is added to fruit juice, carbon dioxide will form as a by-product indicating that it is ready to drink (Alba-Lois et al., 2010).
The particular type of yeast utilized in wine making is known as Saccharomyces cerevisiae. However, wine can be made with many different kinds of yeast, including bread yeast, which is easily obtainable in food markets. This is a popular choice for individuals who wish to create their own wine (Fugelsang et al., 2010).
Wine enthusiasts have varying opinions about the value of wine based on the amount of time it has been fermented for. More expensive wines are typically fermented for longer periods. On the other hand, less expensive and more readily available wines have been fermented for a shorter period of time and this choice is seen as an ideal option for many. Therefore, it would be useful to determine how long it takes to ferment wine in order to gain a greater understanding about the fermentation process and its relationship to expense in the wine industry.
Hypothesis
I hypothesize that it will take more than seven days for yeast to ferment grape juice into wine. If bubbling of the wine is observable, then the grape juice will be considered fermented.
Variables
Independent Variable
The independent variable in this experiment is the length of exposure to bread yeast.
Dependent Variable
The dependent variable in this experiment is carbon dioxide production, which will be measured in the amount of bubbles (measured in centimeters) produced by the grape juice.
Control Variable
The control variable in this experiment is grape juice that is not treated with yeast (negative control). An additional control variable will be the addition of extra yeast (2 pinches) to ensure that equal amounts of yeast are added to each container and that the reaction works (positive control).
Control of Variables
The volume of grape juice in each container will be kept constant (20 mL). In addition, all containers will be kept at room temperature and away from well-light areas. All containers will remain open during the experiment to ensure that there is adequate exposure to oxygen for the chemical reaction to occur. Lastly, the same amount of yeast (a pinch) will be added to each juice container with the exception of the controls.
Materials
- Welch’s grape juice
- 3 oz. plastic cups (88.7 mL)
- Ruler (cm)
- Bread yeast
- Spoon
- 20 mL pipette
- Pipetteman
Method
Seven 3 oz. plastic cups were set out in the same location and labelled 1 to 5, positive control, and negative control. A 20 mL pipette was used to remove exactly 20 mL of grape juice from the Welch’s container and this quantity of juice was placed into each plastic cup. A pinch of bread yeast was placed into cups 1 through 5 and the solutions were mixed. Two pinches of bread yeast was added to the positive control and the solution was mixed. No bread yeast was added to the negative control and care was taken to ensure that this cup would not become contaminated with yeast. These cups were placed away from the light at room temperature and left uncovered to ensure exposure to oxygen.
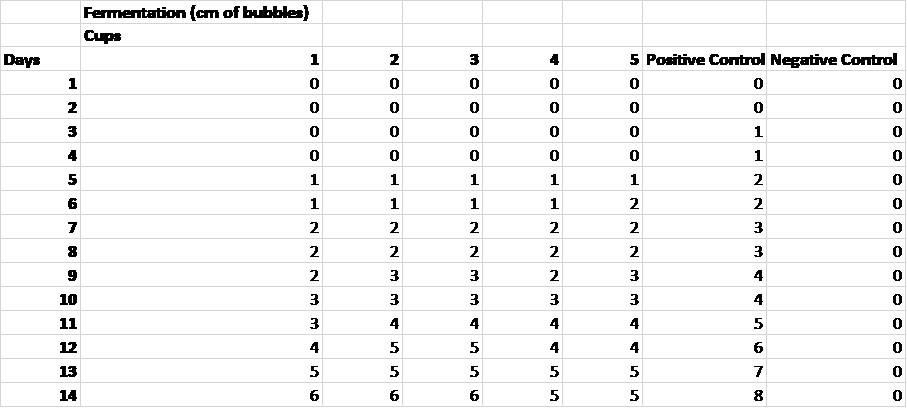
The cups were left for 14 days total, but were observed once a day. Data collection indicated when each cup began to form bubbles, which was used to indicate the initiation of fermentation. Once the carbon dioxide bubbles began to measure a centimeter, this information was recorded to determine the extent of fermentation. This value was rounded to the nearest centimeter. Fermentation was considered complete when the bubbles reached the top of the cup.
To determine the time points in which the fermentation process begins and when it is complete, descriptive statistics were used to determine the central tendency of the data. Furthermore, a correlation between the time of incubation and fermentation was performed. For the purpose of statistical testing, the spread of all data will be assumed normal. To confirm whether there is an association between fermentation and time, a student’s t-test will be performed. For all statistical tests, a p-value of 0.05 or less will be considered statistically significant and all calculations will be performed using Microsoft Excel. Lastly, a percent change calculation will be performed to determine the extent of the increase or decrease in fermentation after seven days. A percent change of greater than 5% will be considered significant.
Data Collection and Processing
Raw Data
Table 1. Indicators of fermentation over a fourteen day period.

Processed Data
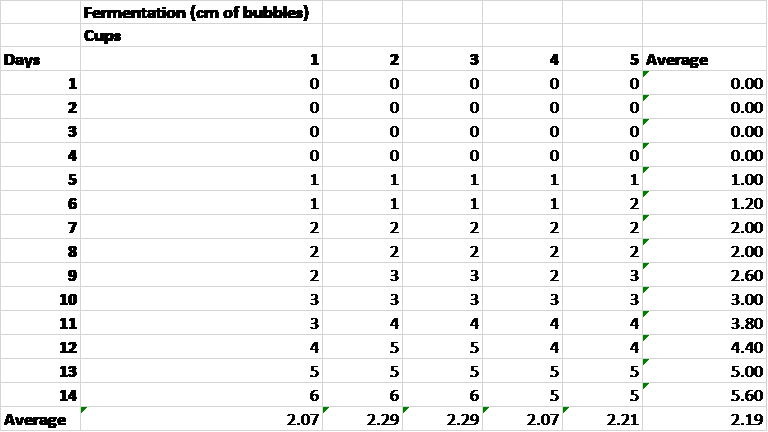
Table 2. Average fermentation per day and over a fourteen day period for each sample.

Table 2 indicates that each sample had an average fermentation of about 2 centimeters worth of bubbles over a 14 day period. The positive control yielded an average fermentation of about 3 centimeters worth of bubbles while the negative control yielded an average fermentation of 0 centimeters worth of bubbles indicating that these results are trustworthy. Fermentation began at day 5 and continued through day 14. Thus, the shortest amount of time required to ferment 20 mL of fruit juice is 5 days.
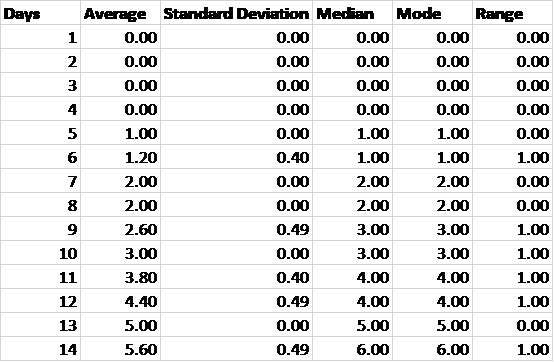
Table 3. Descriptive statistics according to day.

Table 3 demonstrates that the data could be treated as having a normal distribution because the average values are approximately equal to the median values.
A t-test was used to determine whether the fermentation observed during the first week differs from the fermentation observed in the second week. The null hypothesis is that the fermentation observed in the first week as measured by centimeters of bubbles would be equivalent to the fermentation observed in the second week according to the same measurement system. To do so, average fermentation was used to represent each day. The measured significance of the t-test was 0.0001. Therefore, we can reject the null hypothesis.
Next, to determine the difference between the fermentation that occurred in the first week of the experiment and the second, a percent change in fermentation was calculated. The estimated average fermentation of the samples in the first week was 1 cm while the estimated average fermentation of the samples in the second week was 4 cm. Therefore the observed percent change in fermentation is 300%. This value greatly exceeds the minimum parameter of expected change, so the difference in fermentation between the two weeks is emphasized.
The correlation between time in days and fermentation was calculated and is demonstrated in figure 1.
Figure 1. There is a positive correlation between the number of days and extent of fermentation.

Figure 1 indicates that as time continues, fermentation increases. The coefficient of determination is 0.96 while the Pearson correlation value is 0.98, indicating that there is a very strong positive relationship between these two variables.
Conclusion and Evaluation
Conclusion
As indicated above, the fermentation process begins at day 5 but continues to increase significantly until day 14. The relationship between fermentation and time is significant. This information indicates that a substance is likely to reach a higher alcohol concentration as the time it is allowed to ferment increases, which may contribute to the value of aged wine.
Evaluation
A major limitation of this project is that the last time point measured was at 14 days. However, if larger cups were used, it is possible that observable fermentation would continue beyond this period. In addition, only 20 mL of grape juice was used in this study, while the fermentation of juice in industry typically involves a greater quantity. It is therefore possible that these experimental observations were limited by the small quantity of grape juice used, although it would be impossible to mimic the quantities used in industrial manufacturing. Lastly, bread yeast was used in lieu of Saccharomyces cerevisiae in this experiment because this yeast is not commercially available. Although it is not expected that the fermentation rates of these two yeasts differ significantly, differences between the two species may be readily observable in higher concentrations of fruit juice. However, it was impossible to account for this difference in this experiment.
Improvements
This study focuses primarily on the relationship between time and fermentation, although there are likely other factors that impact the rate of fermentation. As a consequence, it would be helpful to measure the effect of the concentration of yeast on fermentation as well. Time and concentration can be used together to more accurately predict how long it will take for larger samples of juice to become fermented. Furthermore, it is difficult to be certain that the temperature was completely controlled. Therefore, it would be useful to conduct the experiment in a temperature controlled incubator set at room temperature. Lastly, it may have been useful to recruit a wine expert who would be able to detect the exact amount of alcohol present in each sample of wine at each time point. If this were to occur, the relationship between time and alcohol concentration could be compared to the relationship between time and fermentation in order to elucidate helpful patterns.
References
Alba-Lois L, Segal-Kischinevzky C. (2010). Yeast Fermentation and the Making of Beer and Wine. Nature Education. Retrieved from http://www.nature.com/scitable/topicpage/yeast-fermentation-and-the-making-of-beer-14372813
Fugelsang K, Edwards C. (2010). Wine Microbiology Second Edition. New York: Springer Science and Business Media.

Stuck with your Lab Report?
Get in touch with one of our experts for instant help!
Tags:

Time is precious
don’t waste it!
writing help!


Plagiarism-free
guarantee

Privacy
guarantee

Secure
checkout

Money back
guarantee

