 All papers examples
Disciplines

- MLA
- APA
- Master's
- Undergraduate
- High School
- PhD
- Harvard
- Biology
- Art
- Drama
- Movies
- Theatre
- Painting
- Music
- Architecture
- Dance
- Design
- History
- American History
- Asian History
- Literature
- Antique Literature
- American Literature
- Asian Literature
- Classic English Literature
- World Literature
- Creative Writing
- English
- Linguistics
- Law
- Criminal Justice
- Legal Issues
- Ethics
- Philosophy
- Religion
- Theology
- Anthropology
- Archaeology
- Economics
- Tourism
- Political Science
- World Affairs
- Psychology
- Sociology
- African-American Studies
- East European Studies
- Latin-American Studies
- Native-American Studies
- West European Studies
- Family and Consumer Science
- Social Issues
- Women and Gender Studies
- Social Work
- Natural Sciences
- Anatomy
- Zoology
- Ecology
- Chemistry
- Pharmacology
- Earth science
- Geography
- Geology
- Astronomy
- Physics
- Agriculture
- Agricultural Studies
- Computer Science
- Internet
- IT Management
- Web Design
- Mathematics
- Business
- Accounting
- Finance
- Investments
- Logistics
- Trade
- Management
- Marketing
- Engineering and Technology
- Engineering
- Technology
- Aeronautics
- Aviation
- Medicine and Health
- Alternative Medicine
- Healthcare
- Nursing
- Nutrition
- Communications and Media
- Advertising
- Communication Strategies
- Journalism
- Public Relations
- Education
- Educational Theories
- Pedagogy
- Teacher's Career
- Statistics
- Chicago/Turabian
- Nature
- Company Analysis
- Sport
- Paintings
- E-commerce
- Holocaust
- Education Theories
- Fashion
- Shakespeare
- Canadian Studies
- Science
- Food Safety
- Relation of Global Warming and Extreme Weather Condition
Paper Types

- Movie Review
- Essay
- Admission Essay
- Annotated Bibliography
- Application Essay
- Article Critique
- Article Review
- Article Writing
- Assessment
- Book Review
- Business Plan
- Business Proposal
- Capstone Project
- Case Study
- Coursework
- Cover Letter
- Creative Essay
- Dissertation
- Dissertation - Abstract
- Dissertation - Conclusion
- Dissertation - Discussion
- Dissertation - Hypothesis
- Dissertation - Introduction
- Dissertation - Literature
- Dissertation - Methodology
- Dissertation - Results
- GCSE Coursework
- Grant Proposal
- Admission Essay
- Annotated Bibliography
- Application Essay
- Article
- Article Critique
- Article Review
- Article Writing
- Assessment
- Book Review
- Business Plan
- Business Proposal
- Capstone Project
- Case Study
- Coursework
- Cover Letter
- Creative Essay
- Dissertation
- Dissertation - Abstract
- Dissertation - Conclusion
- Dissertation - Discussion
- Dissertation - Hypothesis
- Dissertation - Introduction
- Dissertation - Literature
- Dissertation - Methodology
- Dissertation - Results
- Essay
- GCSE Coursework
- Grant Proposal
- Interview
- Lab Report
- Literature Review
- Marketing Plan
- Math Problem
- Movie Analysis
- Movie Review
- Multiple Choice Quiz
- Online Quiz
- Outline
- Personal Statement
- Poem
- Power Point Presentation
- Power Point Presentation With Speaker Notes
- Questionnaire
- Quiz
- Reaction Paper
- Research Paper
- Research Proposal
- Resume
- Speech
- Statistics problem
- SWOT analysis
- Term Paper
- Thesis Paper
- Accounting
- Advertising
- Aeronautics
- African-American Studies
- Agricultural Studies
- Agriculture
- Alternative Medicine
- American History
- American Literature
- Anatomy
- Anthropology
- Antique Literature
- APA
- Archaeology
- Architecture
- Art
- Asian History
- Asian Literature
- Astronomy
- Aviation
- Biology
- Business
- Canadian Studies
- Chemistry
- Chicago/Turabian
- Classic English Literature
- Communication Strategies
- Communications and Media
- Company Analysis
- Computer Science
- Creative Writing
- Criminal Justice
- Dance
- Design
- Drama
- E-commerce
- Earth science
- East European Studies
- Ecology
- Economics
- Education
- Education Theories
- Educational Theories
- Engineering
- Engineering and Technology
- English
- Ethics
- Family and Consumer Science
- Fashion
- Finance
- Food Safety
- Geography
- Geology
- Harvard
- Healthcare
- High School
- History
- Holocaust
- Internet
- Investments
- IT Management
- Journalism
- Latin-American Studies
- Law
- Legal Issues
- Linguistics
- Literature
- Logistics
- Management
- Marketing
- Master's
- Mathematics
- Medicine and Health
- MLA
- Movies
- Music
- Native-American Studies
- Natural Sciences
- Nature
- Nursing
- Nutrition
- Painting
- Paintings
- Pedagogy
- Pharmacology
- PhD
- Philosophy
- Physics
- Political Science
- Psychology
- Public Relations
- Relation of Global Warming and Extreme Weather Condition
- Religion
- Science
- Shakespeare
- Social Issues
- Social Work
- Sociology
- Sport
- Statistics
- Teacher's Career
- Technology
- Theatre
- Theology
- Tourism
- Trade
- Undergraduate
- Web Design
- West European Studies
- Women and Gender Studies
- World Affairs
- World Literature
- Zoology
Hours Spent Watching Television and International Baccalaureate Grades, Lab Report Example
Hire a Writer for Custom Lab Report
Use 10% Off Discount: "custom10" in 1 Click 👇
You are free to use it as an inspiration or a source for your own work.

The Relationship Between the Hours Spent Watching Television and International Baccalaureate Grades
Introduction
Many individuals believe that participating in dormant activities contributes to a decrease in academic success. Television is a widely accessible activity that many students report to engage in at various points throughout the school week, although some practice this activity more frequently than others. In addition, many students and educators believe that the international baccalaureate is an essential contributor to the future success of an individual; if a student receives a high international baccalaureate grade, he or she is more likely to perform well in higher education and in life. Furthermore, the successful international baccalaureate project allows an individual to experience a research opportunity in a specialized field of training which may help elucidate the career path that the individual wishes to take.
Parents, in addition to members of the general population believe that success in school is directly dependent upon dedication to school work, which involves engagement in rigorous studying. Dormant activities like television can potentially detract from a student’s ability to study as frequently and effectively as is typically expected from him or her. It has been observed that students who perform poorly engage in such activities more frequently than those who perform well. As a consequence, I hypothesize that the more hours an individual watches television, the lower their international baccalaureate grade will be. Likewise, the less hours an individual watches television, the higher international baccalaureate grade will be. The rationalization of this theory is that since the completion of the international baccalaureate project is time consuming and requires a lot of dedication, only the students who put in time and effort into their projects will succeed. This research question will help determine whether watching television is really responsible for lowering academic grades and apply this generalization to the specific situation of the international baccalaureate.
To determine the relationship between international baccalaureate grades and the number of hours of television watched by the grade recipients, I surveyed students who had completed the international baccalaureate exam in the past. To gather this data, I asked them two questions “How many hours a week do you think you watched television when you were enrolled in the international baccalaureate program?”, and “What was your international baccalaureate grade?”. I asked participants to round the hours of television up to the nearest hour in order to receive data that is more generalizable to the study population. Students who were unsure of the number of hours of television watched either during the international baccalaureate program or currently were asked to guess an approximate number of hours.
In total, I approached 40 former international baccalaureate students and asked them to complete my survey and all of them agreed. I recorded my results in the form of an excel spreadsheet and performed statistical analysis using this program as well. Descriptive statistics were calculated first to determine the average number of hours of television watched by my sample in addition to the average international baccalaureate grades they received. In addition, standard deviation was calculated. The sample distribution was then graphed to determine whether the parametric or non-parametric statistical tests would be used and to determine the general trend of the responses I received. Next, I completed the student’s t-test or its non-parametric equivalent if necessary to determine the association between the hours of television watched and the international baccalaureate grades received. A p-value of 0.05 of less was considered significant for this specific test. In order to determine the independence of the association, I performed a x2 test. A p-value of 0.05 or less was also considered to be significant for this test. Excel was used to generate statistical data for the student’s t-test.
Plan of Investigation
- Surveys will be created that ask former international baccalaureate students about the grade the received and how many hours of television they watched per week while completing their project
- Forty students will be approached
- Survey results will be compiled in an Excel spreadsheet
- Scatter plot will be made to show the correlation between the two variables
- Descriptive statistics will be used to summarize the data
- Frequency and cumulative frequency will be measured
- The association between hour of television watched and international baccalaureate grade will be examined using the student t-test
- The independence of the association will be measured by conducting a x2 test
Methods
As stated above, the data will be generated based on surveys that will be issued to former international baccalaureate students. The former international baccalaureate students will be identified on the basis of either my previous interactions with them or by asking my teachers for their contact information if they’re still in touch. The two questions asked were “How many hours a week do you think you watched television when you were enrolled in the international baccalaureate program?”, and “What was your international baccalaureate grade?”
To effectively organize the data I collected for interpretation, I created an excel spreadsheet with the categories “Television Hours per Week in IB” and “International Baccalaureate Grade”. Excel was used to calculate the descriptive statistics and the student’s t-test and the x2 test was performed by hand.
Results
To determine the general correlation between hours of television watched and international baccalaureate score, a scatter plot was made plotting. Hours of television watched was the independent variable (x) and international baccalaureate grade was the dependent variable (y). This plot can be seen below in figure 1.
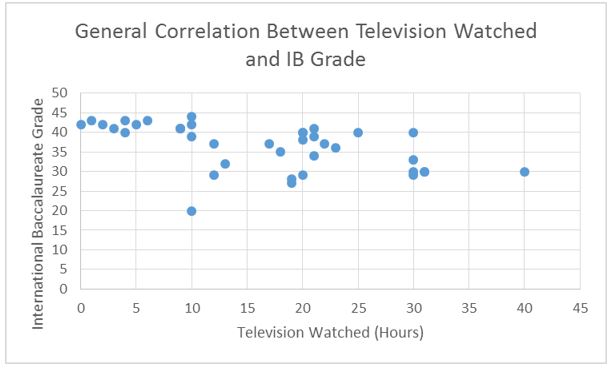
Figure 1 There is a downward trend; as the number of hours of television watched increases, the international baccalaureate score decreases.
Three different regressions were selected to determine which regression is a best fit for the data according to which one has the highest R2. Linear, exponential, and polynomial regressions were examined. The linear regression is shown in figure 2, the exponential regression is shown in figure 3, and the polynomial regression is shown in figure 4.
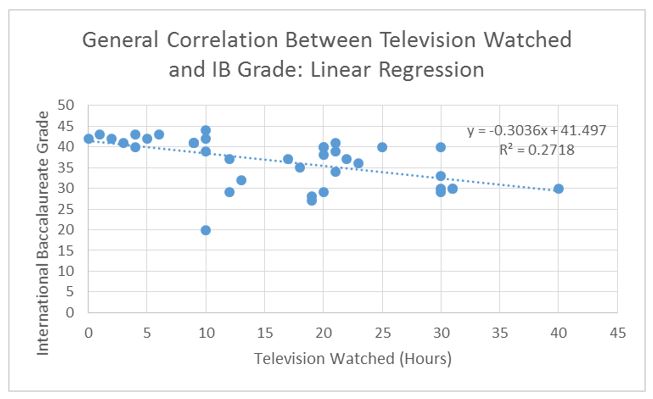
Figure 2 Linear Regression
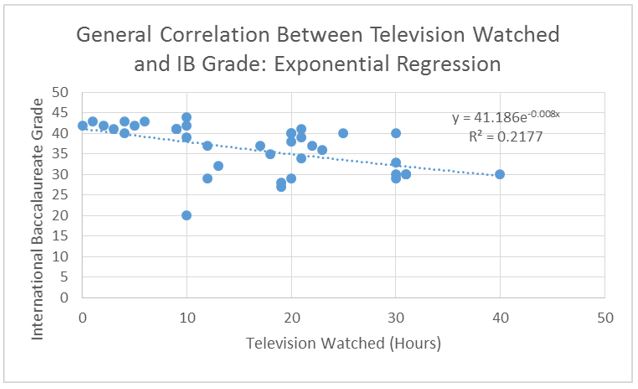
Figure 3 Exponential Regression
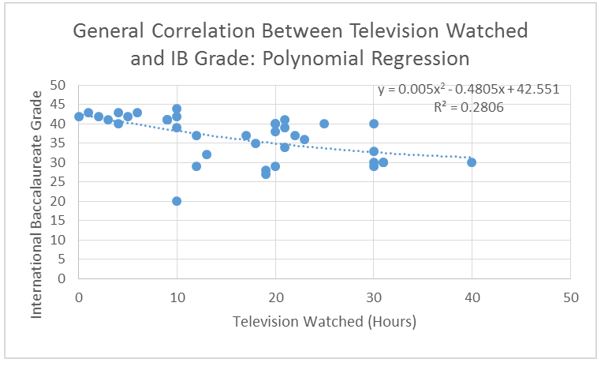
Figure 4 Polynomial Regression
According to the R2 value for these regressions, the polynomial regression is the best fit (figure 4). Therefore, this relationship will be considered to have a correlation of 0.28.
Next, descriptive statistics were calculated. The average hours of television watched per week among the participants was 16.9 hours with a standard deviation of 10.4. The median hours of television watched was 18.5, the mode was 20, and the range was 40. The average international baccalaureate grade was 36.3 with a standard deviation of 5.9. The median international baccalaureate grade was 38.5, the mode was 40, and the range was 17. Since the median and mean are approximately equal, we can assume that these variables are normal distributed.
Since the data for these variables have been shown to be normally distributed, the student’s t-test will be used to determine the association between weekly hours of television watched and international baccalaureate grades. The type of t-test used will be a paired t-test with the equal variance assumption. The p-value given for this test was 3.4 x 10⁻¹⁰. Since this value is less than 0.05, the results are statistically significant. This means that the null hypothesis that the variance of the hours of television watched while in the international baccalaureate program and the international baccalaureate scores received are equal is rejected.
The frequency and cumulative frequency for number of hours of television watched and international baccalaureate score were determined. Table 1 shows the frequency summary for number of television hours watched and table 2 shows the frequency summary for international baccalaureate grades. Table 3 shows a 4 x 4 table according to frequency of both variables.
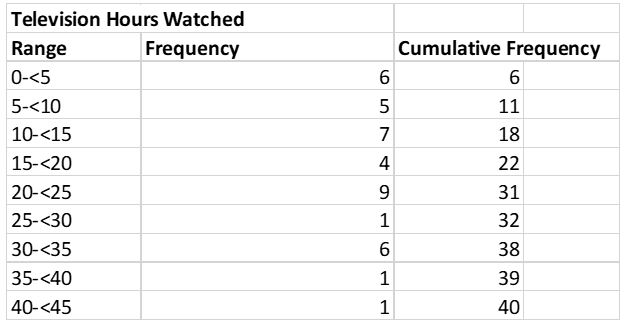
Table 1 Frequency and cumulative frequency for television hours watched

Table 2 Frequency and cumulative frequency for international baccalaureate grade
| Number of Hours of Television Watched | TOTAL | |||||
|
IB Grade |
Below 25% | Between 25% and 50% | Between50% and 75% | Above 75% | ||
| Below 25% | 0 | 1 | 4 | 2 | 7 | |
| Between 25% and 50% | 0 | 5 | 2 | 6 | 13 | |
| Between50% and 75% | 1 | 1 | 3 | 2 | 7 | |
| Above 75% | 10 | 2 | 1 | 0 | 13 | |
| TOTAL | 11 | 9 | 10 | 10 | 40 | |
Table 3 4×4 table showing frequency of both variables
Since there are less than 5 samples in most of the boxes in table 3, a 2×2 table was made for the x2 test. Both variables were dichotomized at the median; below the median is considered to be a low international baccalaureate grade or number of hours of television watched and above the median is considered to be a high international baccalaureate grade or numbers of television watched. A 3×3 table would still have resulted in boxes with a sample of less than 5. The 2×2 table can be seen below in table 4.
2 x 2 Table
| Below Median | Above Median | Total | |
| Below Median | 6 | 14 | 20 |
| Above Median | 14 | 6 | 20 |
| Total | 20 | 20 | 40 |
Hours of Television Watched

Table 4 2×2 table
Using the information from table 4, the x2 test was performed using Yates’ correction. The x2 value was equal to 4.900 with 1 degrees of freedom. The two-tailed P value equals 0.0269, meaning that this test is statistically significant. The general formula for Yates’ correction is as follows:

Since a 2×2 table was used, a simpler version of this is:
![]()
Where Ns represents the below median hours of television watched, NF represents the above median hours of television watched, NA represents the below median IB grade, and NA represents the above median IB grade. A, b, c, and d represent the values in the 2×2 table that belong to each category. This formula is useful because it accounts for the expected values.
Discussion
It is confirmed that there is an association between international baccalaureate grades and amount of weekly television hours watched according to the results of the student’s t-test, which gave statistically significant findings. In addition, the results of the x2 were significant so this is an independent relationship. However, the correlation of these two variables was low. Therefore, we cannot be sure of the strength of the relationship.
The data and results supported the hypothesis in the sense that it confirmed a relationship between hours of television watched and international baccalaureate grades. However, it is difficult to determine what variable causes the other, although it is likely that low levels of television viewing causes high international baccalaureate grades and not the other way around. To determine the strength and direction of this association, it would be more useful to complete a prospective study of the relationship and calculate a relative risk. To do so, I would survey students who are in the international baccalaureate program right now, and track the amount of television hours they watch by asking them every week and keeping a chart on each individual. After the participants receive their international baccalaureate grade, I would track this as well. This would be a more advantageous way to answer my research question because I will have access to a greater amount of students, which will allow me to randomize participants more effectively in a manner that prevents against selection bias. Furthermore, a larger sample will mean that my results will be more accurate. Finally, a prospective study would be more effective because it would prevent against recall bias; instead of depending upon the participants to tell me how many hours they think they watched in the past, they will be reporting the number of hours to me as they go, so it will be more accurate.
Ultimately however, this type of study only has internal validity for the people I know and asked to participate. This trend may differ in other schools and countries, although we can be relatively certain that these results hold true for our own students and may reflect future trends. Overall, this study shows that there is a link between hours of television and grades, so it is recommended to avoid television when working on important projects like the international baccalaureate.
Appendix
Survey Raw Data
| Television Hours/Week in IB | IB Grade | |
| 1 | 9 | 41 |
| 2 | 20 | 40 |
| 3 | 10 | 42 |
| 4 | 17 | 37 |
| 5 | 40 | 30 |
| 6 | 10 | 44 |
| 7 | 0 | 42 |
| 8 | 20 | 40 |
| 9 | 30 | 29 |
| 10 | 22 | 37 |
| 11 | 30 | 33 |
| 12 | 19 | 28 |
| 13 | 5 | 42 |
| 14 | 20 | 38 |
| 15 | 12 | 29 |
| 16 | 30 | 40 |
| 17 | 25 | 40 |
| 18 | 18 | 35 |
| 19 | 10 | 20 |
| 20 | 3 | 41 |
| 21 | 2 | 42 |
| 22 | 19 | 27 |
| 23 | 31 | 30 |
| 24 | 9 | 41 |
| 25 | 1 | 43 |
| 26 | 21 | 41 |
| 27 | 31 | 30 |
| 28 | 23 | 36 |
| 29 | 21 | 34 |
| 30 | 20 | 29 |
| 31 | 6 | 43 |
| 32 | 21 | 39 |
| 33 | 13 | 32 |
| 34 | 4 | 40 |
| 35 | 4 | 43 |
| 36 | 30 | 30 |
| 37 | 10 | 39 |
| 38 | 12 | 37 |
| 39 | 9 | 41 |
| 40 | 39 | 27 |
Table 5 Raw data summarizing the number of hours of television watched per week while taking the international baccalaureate versus the international baccalaureate grade received

Stuck with your Lab Report?
Get in touch with one of our experts for instant help!
Tags:

Time is precious
don’t waste it!
writing help!


Plagiarism-free
guarantee

Privacy
guarantee

Secure
checkout

Money back
guarantee

