 All papers examples
Disciplines

- MLA
- APA
- Master's
- Undergraduate
- High School
- PhD
- Harvard
- Biology
- Art
- Drama
- Movies
- Theatre
- Painting
- Music
- Architecture
- Dance
- Design
- History
- American History
- Asian History
- Literature
- Antique Literature
- American Literature
- Asian Literature
- Classic English Literature
- World Literature
- Creative Writing
- English
- Linguistics
- Law
- Criminal Justice
- Legal Issues
- Ethics
- Philosophy
- Religion
- Theology
- Anthropology
- Archaeology
- Economics
- Tourism
- Political Science
- World Affairs
- Psychology
- Sociology
- African-American Studies
- East European Studies
- Latin-American Studies
- Native-American Studies
- West European Studies
- Family and Consumer Science
- Social Issues
- Women and Gender Studies
- Social Work
- Natural Sciences
- Anatomy
- Zoology
- Ecology
- Chemistry
- Pharmacology
- Earth science
- Geography
- Geology
- Astronomy
- Physics
- Agriculture
- Agricultural Studies
- Computer Science
- Internet
- IT Management
- Web Design
- Mathematics
- Business
- Accounting
- Finance
- Investments
- Logistics
- Trade
- Management
- Marketing
- Engineering and Technology
- Engineering
- Technology
- Aeronautics
- Aviation
- Medicine and Health
- Alternative Medicine
- Healthcare
- Nursing
- Nutrition
- Communications and Media
- Advertising
- Communication Strategies
- Journalism
- Public Relations
- Education
- Educational Theories
- Pedagogy
- Teacher's Career
- Statistics
- Chicago/Turabian
- Nature
- Company Analysis
- Sport
- Paintings
- E-commerce
- Holocaust
- Education Theories
- Fashion
- Shakespeare
- Canadian Studies
- Science
- Food Safety
- Relation of Global Warming and Extreme Weather Condition
Paper Types

- Movie Review
- Essay
- Admission Essay
- Annotated Bibliography
- Application Essay
- Article Critique
- Article Review
- Article Writing
- Assessment
- Book Review
- Business Plan
- Business Proposal
- Capstone Project
- Case Study
- Coursework
- Cover Letter
- Creative Essay
- Dissertation
- Dissertation - Abstract
- Dissertation - Conclusion
- Dissertation - Discussion
- Dissertation - Hypothesis
- Dissertation - Introduction
- Dissertation - Literature
- Dissertation - Methodology
- Dissertation - Results
- GCSE Coursework
- Grant Proposal
- Admission Essay
- Annotated Bibliography
- Application Essay
- Article
- Article Critique
- Article Review
- Article Writing
- Assessment
- Book Review
- Business Plan
- Business Proposal
- Capstone Project
- Case Study
- Coursework
- Cover Letter
- Creative Essay
- Dissertation
- Dissertation - Abstract
- Dissertation - Conclusion
- Dissertation - Discussion
- Dissertation - Hypothesis
- Dissertation - Introduction
- Dissertation - Literature
- Dissertation - Methodology
- Dissertation - Results
- Essay
- GCSE Coursework
- Grant Proposal
- Interview
- Lab Report
- Literature Review
- Marketing Plan
- Math Problem
- Movie Analysis
- Movie Review
- Multiple Choice Quiz
- Online Quiz
- Outline
- Personal Statement
- Poem
- Power Point Presentation
- Power Point Presentation With Speaker Notes
- Questionnaire
- Quiz
- Reaction Paper
- Research Paper
- Research Proposal
- Resume
- Speech
- Statistics problem
- SWOT analysis
- Term Paper
- Thesis Paper
- Accounting
- Advertising
- Aeronautics
- African-American Studies
- Agricultural Studies
- Agriculture
- Alternative Medicine
- American History
- American Literature
- Anatomy
- Anthropology
- Antique Literature
- APA
- Archaeology
- Architecture
- Art
- Asian History
- Asian Literature
- Astronomy
- Aviation
- Biology
- Business
- Canadian Studies
- Chemistry
- Chicago/Turabian
- Classic English Literature
- Communication Strategies
- Communications and Media
- Company Analysis
- Computer Science
- Creative Writing
- Criminal Justice
- Dance
- Design
- Drama
- E-commerce
- Earth science
- East European Studies
- Ecology
- Economics
- Education
- Education Theories
- Educational Theories
- Engineering
- Engineering and Technology
- English
- Ethics
- Family and Consumer Science
- Fashion
- Finance
- Food Safety
- Geography
- Geology
- Harvard
- Healthcare
- High School
- History
- Holocaust
- Internet
- Investments
- IT Management
- Journalism
- Latin-American Studies
- Law
- Legal Issues
- Linguistics
- Literature
- Logistics
- Management
- Marketing
- Master's
- Mathematics
- Medicine and Health
- MLA
- Movies
- Music
- Native-American Studies
- Natural Sciences
- Nature
- Nursing
- Nutrition
- Painting
- Paintings
- Pedagogy
- Pharmacology
- PhD
- Philosophy
- Physics
- Political Science
- Psychology
- Public Relations
- Relation of Global Warming and Extreme Weather Condition
- Religion
- Science
- Shakespeare
- Social Issues
- Social Work
- Sociology
- Sport
- Statistics
- Teacher's Career
- Technology
- Theatre
- Theology
- Tourism
- Trade
- Undergraduate
- Web Design
- West European Studies
- Women and Gender Studies
- World Affairs
- World Literature
- Zoology
Process Gone Wrong Located, Research Paper Example
Hire a Writer for Custom Research Paper
Use 10% Off Discount: "custom10" in 1 Click 👇
You are free to use it as an inspiration or a source for your own work.

Message To The President
The Quality Assurance department has concluded that some changes need to be made to the precision die casting process. There is considered to be some variation to an assignable cause. This suggests that some part of the process has gone adrift and is not performing to specification or requirements. It is suspected that this is the main cause for the increase in defects. In order to resolve this issue we need to adopt the following procedures:
- Completion of a Cause and Effect diagram
- Business Process Analysis or Deployment Flow Charts
- Pareto Chart
- Stratification
The above analytical approach addresses the problem from different perspectives as it is not clear whether the precise error resides in the fault of business processes. This report will explain the different method approaches and the result that is expected from each of them. In this manner we should narrow the field to the precise cause of the problem to address. We should not immediately start changing business processes until we have a precise understanding of the root cause of the problem and the precise effect this is having on the business. QA might have identified an increase in defects but equally there may be other aligned serious deficiencies that need to be addressed. These may not necessarily be attributed to faulty business processes. Note: QA did not detect any changes to the business processes.
The following describes the diagnostic approach to getting the business back on track.
Use Of Cause And Effect Diagrams
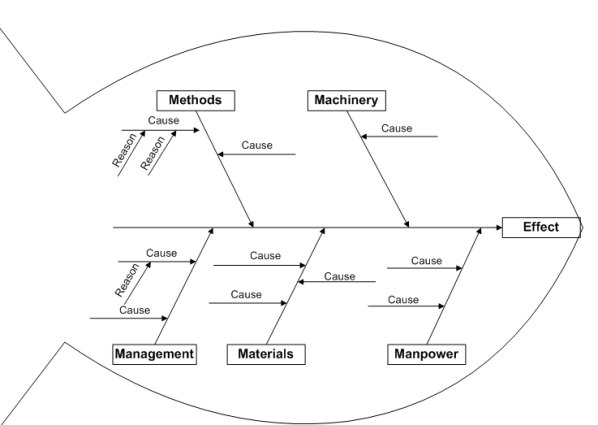
These diagrams facilitate problem solving and enable you to analyse a problem in a thorough manner. The analysis gets you to the root cause of the problem without just selecting what appears to be the obvious solution i.e. Defects = Poor processes. This approach uses the group dynamics of brain storming and getting collective different perspectives on the problem statement. These diagrams, also called Fishbone Diagrams ( Fig 1 refers) are a toolset for the analysis of problems and follow these procedures: (Mind Tools.com, 2011)
Identification of the Problem – The problem is first clearly defined and written down as a statement of when and where it occurs. This statement is written at the top left of a large sheet of paper. A horizontal line is then drawn with the appearance of a spine and bones of a fish. This provides the area for developing ideas.

Figure 1 Example Fishbone Diagram
Determine major factors involved – Determine the major contributory factors that might be the result of the increase in defects. These should be entered in the lines off the central spine. The objective is to document as many factors as deemed possible. Consider both internal and external factors.
Identify possible Causes – Brainstorm possible causes that relate to each factor , these illustrated as small lines coming off the bones of the fish, as illustrated in Fig 1 above. Where complex issues occur you can enter sub headings to each of these factors. Don’t go too detailed though as we are trying to obtain a holistic representation of cause and effect at this point.
Analysis of Diagram – The diagram should now provide an illustration of all the causes of the problem. This should form the basis of the area of investigation. The diagram thus provides a more accurate navigation to where the search should commence. For example in addition to business processes a number of other key areas have emerged i.e. Production Control, Resources, Increase in Sales Demand, Substitute parts in Inventory control etc. (Goetsch, D.L. 2010)
Business Process Analysis
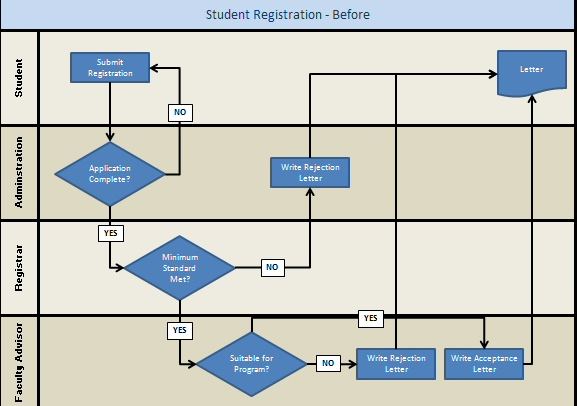
Deployment Flow Charts ( Swim Lanes) are a means of visually describing the business processes by means of a flow chart representation. In this case we are able to map the process flows of the precision die cast from start to finish. This will then provide a precise depiction of each of the business processes in the production cycle. Any deviations or duplication of effort can then be visually detected from this chart. This is accomplished by taking a step-by-step walk through of each process with the individuals concerned. This will capture both manual and automated process steps. Colour coding can depict the difference between a manual and automated production process. ( Fig 2 refers)

Figure 2 Deployment Flowchart Example
The advantage of this chart is that the die cast process can be split up into the production sections and each of the processes mapped within it. This illustrates the relationship between processes and production categories. The current state process chart can then be compared with the master blueprint ( correct procedure) in order to determine if any duplications or errors exist. (Capper, R. 1998)
Pareto Chart
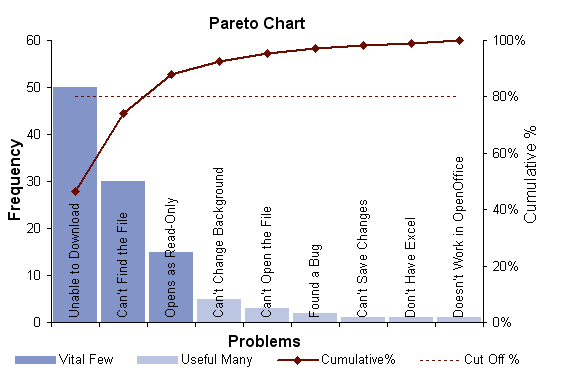
These are considered to be useful tools in order to split out important information from trivial data. The Pareto principle is based upon the premise that a minority of causes lead to the majority of problems (Goetsch, D.L. 2010). In this case you may determine that only about 20% of all the problems in the Factory account for 80% of the causes behind the reultant defects from production. This narrows the field of search down considerably to only 20% of causation factors in order to remedy 80% of the problem. The cause and effect analysis can help in the identification of the main causes. The subsequent investigations should reveal the impacts to the business from these main causes. These can then be plotted on a graph in order to illustrate both cause and effect and impact to the business.
Fig 3 illustrates such a chart and you can see how this illustrates the frequency of the vital flaws and cumulative %. The highest of these representing a flaw in excess of 50 with a cumulative % in excess of 80

Figure 3 Example Pareto Chart
Stratification
A further extension of the Pareto analysis is that of stratification. This looks at investigating the causes of a problem by placing them into groups. The business process analysis and cause and effect data can be useful inputs into the stratification process. The idea of this approach is that the further you decompose or stratify the problem, then the closer you will become to understanding and determining the root cause of the problem. An example might be the dissemination of a machinists time in a specific process area that has been highlighted as a major contributory factor to creating a defect in the final product. (Goetsch, 2010)
References
Capper, R. (1998). A project-by-project approach to quality: a practical handbook for . In R. Capper, A project-by-project approach to quality: a practical handbook for (pp. 199-201). London: Gower.
Goetsch, D. (2010). Quality Management for Organizational Excellence: Introduction to total quality. New York: Prentice Hall.
Mind Tools.com. (2011, 11 24). Cause and Effect Diagrams. Retrieved from Mind Tools.com: http://mindtools.com/

Stuck with your Research Paper?
Get in touch with one of our experts for instant help!
Tags:

Time is precious
don’t waste it!
writing help!


Plagiarism-free
guarantee

Privacy
guarantee

Secure
checkout

Money back
guarantee

