Temperature Sensor With LCD Disp & Led Indicator, Lab Report Example
Problem statement
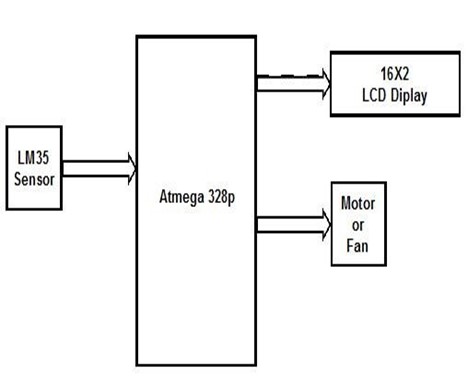
This project is a self-contained automated fan speed controller that regulates the speed of an electric fan to our specifications [1]. This closed loop feedback control system is efficient and dependable thanks to the use of embedded technology. Microcontrollers (ATMega8/168/328) enable for more dynamic and quicker control [1]. The system is made more user-friendly with a liquid crystal display (LCD). The LCD screen concurrently displays the detected temperature and fan speed level data [1]. Air conditioners, water heaters, snow melters, ovens, heat exchangers, mixers, furnaces, incubators, thermal baths, and veterinary operating tables are just a few of the applications for which it may be used. The ARDUINO microcontroller, which controls all operations, is at the core of the circuit [1]. The LM35 temperature sensor detects the temperature and transforms it to an electrical (analog) signal that is sent to the microcontroller. The temperature is shown on a 16×2-line LCD with the detected and configured values [1]. To regulate the fan speed, the microcontroller drives a transistor. A controlled 12V/2A power supply is used in this project. This project may be used to maintain and regulate the temperature of boilers in the process industry.
Introduction
Intelligent systems are being launched on a daily basis as a result of technological progress. Everything is becoming more complex and understandable [1]. In recent years, there has been a rise in the need for cutting-edge technology and intelligent electronic systems. Microcontrollers are very essential in the creation of smart systems since they act as the system’s brain, allowing it to function properly [2]. New technologies are being launched on a regular basis, and microcontrollers have become the brains of such innovations [2]. When it comes to microcontrollers, they are mostly single-chip microprocessors that are used for the control and automation of equipment and processes [2]. Currently, microcontrollers are being utilized in a wide variety of fields to do automated activities in a more precise way than ever before. Microcontrollers are used in almost every modern day equipment, including air conditioners, power tools, toys, and office machinery, to regulate their operation and functionality [2]. A microcontroller is basically a single chip that has a Central Processing Unit (CPU), timers and counters, interrupts, memory, input/output ports, and analog to digital converters (ADC). It is possible to decrease the size of the control board and the power consumption of the microcontroller by using a single chip integrated circuit architecture for the microcontroller [2]. This project shows the design and modeling of a fan speed control system depending on the room temperature, which is implemented using the PWM method [1]. In order to monitor the temperature of the room, a temperature sensor has been installed, and the fan speed has been adjusted in response to the measured temperature using the PWM method [3]. The fan speed is controlled by varying the duty cycle from 0 to 100, which is shown on the Liquid Crystal Display and is dependent on the ambient temperature displayed on the LCD [1].
Decision making
After completing our choice matrix, we determined that we would finish our project by using the PDV-P9007 photoresistor [3]. We arrived at this conclusion by weighing the cost, sensitivity, light resistance range, and reaction time [4]. This photoresistor got the greatest score when compared to the NSL5152 and NSL19M51 photoresistors, which is why we chose it [4].
Build and test:
The temperature-based fan speed control system may be implemented via the use of an electrical circuit based on the Arduino board [4]. Because the Arduino board is one of the most forward-thinking electrical circuits available today, we used an Arduino board to regulate the fan speed. The suggested system is intended to detect the temperature of a room and transmit that information to an Arduino board through a wireless connection [4]. The Arduino board then does the temperature comparison between the current temperature and the specified temperature in accordance with the Arduino’s built-in software. In this case, the result of the operation is sent to the LCD display of relevant data through the o/p port of an Arduino board [4]. The fan’s output is controlled by the produced pulses from the board, which are then sent to the driver circuit to produce the desired output.
Demo results
The demonstration experiment drew considerable criticism, but in the end it showed an overview of the project that would be executed [4]. There were certain limitations in the demo, thus some of the components were not installed [4]. Some of the experiment’s findings may be shown on the demonstration instrument. The demonstration instrument had a few flaws, such as incorrect findings [4]. There were a few broken keys on the keyboard. It’s possible to fix the problem by using the most up-to-date and sophisticated equipment currently accessible.
Flowchart
Working principle
A method called Pulse Width Modulation (PWM) allows you to achieve analog effects using digital technology [2]. To generate a square wave, digital control is utilized to alternately turn on and off the signal. Changing the amount of time the signal is on compared to the amount of time the signal is off may mimic voltages between full on (5 Volts) and off (0 Volts) [2]. The pulse width refers to the length of “on time.” It is necessary to modify the pulse width in order to get a range of analog values. With an LED, for example, we may simulate a constant voltage between 0 and 5v regulating the LED’s brightness by rapidly repeating this on-off sequence [2]. In the illustration below, a normal time period is shown by the green lines. The inverse of PWM frequency is this period’s duration.
Temperature Sensor:
As a temperature sensor, we are using the LM 35. The LM 35 is a high-precision temperature sensor whose output is directly proportional to the temperature measured in degrees Celsius [2]. The LM35 is rated to work from -55° Centigrade to 150° Centigrade with a linear scale factor of +10mv/° C and a temperature range of 0° Centigrade to 150° Centigrade [2].
Liquid Crystal Display:
The LCD (liquid crystal display) is a dot matrix liquid crystal display that shows alphanumeric and symbol characters [3]. The room temperature is shown on a 16×2 LCD digital display, which has been integrated into the system. LCDS (Liquid Crystal Display) screens are electrical display modules that may be used in a variety of different applications [3]. It is extremely usual to find a 16×2 LCD display in different devices and circuits since it is such a fundamental module. These modules are favored over seven segment and other multi segment LEDs in terms of brightness and efficiency [3]. The reasons for this are as follows: LCDs are cost-effective; they are readily programmed; they do not have any limitations in terms of showing unique and even customized characters (unlike seven segments), animations, and so on [3]. A 16×2 LCD implies that it can show 16 characters per line and that there are two lines of this size available. Using a 5×7 pixel grid, each character is shown on this LCD screen [3]. This LCD contains two registers, which are referred to as the Command and Data registers. The command register is responsible for storing the commands that are sent to the LCD. When you give your LCD a command, it will do a specified job, such as initializing it, cleaning its screen, establishing the cursor location, and managing the display, among other things [3]. The data register is responsible for storing the information that will be shown on the LCD [3]. The data consists of the ASCII value of the character that will be shown on the LCD display screen.
Arduino UNO Basic Information:
Arduino is a hardware and software development platform for open-source electronics projects. Using Arduino boards, you can take inputs like a sensor reading light and turning on an LED or sending a tweet and convert them into outputs like actuating a motor or posting anything online. Sending instructions to the board’s microcontroller will instruct it what to do [3]. For this, you’ll need Arduino (based on Wiring) and the Arduino Integrated Development Environment (IDE), both of which are based on Processing [3]. Everyday items to sophisticated scientific equipment have been controlled using Arduino for years [2]. Thousands of people from all over the globe have flocked to this open-source platform to share their expertise, and their efforts have resulted in a wealth of information that may be helpful to both beginners and specialists [2]. Students with no prior knowledge of electronics or programming were the target audience for Arduino when it was developed at the Ivrea Interaction Design Institute [2]. Arduino’s product line evolved from basic 8-bit boards to devices for Internet of Things (IoT) applications, wearables, 3D printing, and embedded environments as soon as it became popular among a larger audience [2]. All Arduino boards are open-source, allowing users to create and customize them to suit their own requirements. Arduino has been utilized in hundreds of various projects and applications because to its easy and accessible user experience. The software is also open-source [2]. Despite its ease of use, Arduino’s software is powerful enough for even the most inexperienced users. It’s compatible with Mac, Windows, and Linux systems [2]. You may use it to construct low-cost scientific equipment, verify chemistry and physics concepts, or get started with programming and robotics [2]. It is used by architects and designers to create interactive prototypes, while musicians and artists utilize it for installations and to try out new musical instruments. Many of the projects shown at the Maker Faire, for example, are built with the help of it, as Makers can attest. Arduino is a valuable learning tool. To get started, simply follow the step-by-step instructions in the kit or share your ideas with the Arduino community online. It’s great for kids, hobbyists, artists, and programmers alike. For physical computing, a wide variety of microcontrollers and microcontroller platforms are available [2]. Many other devices, such as the Parallax Basic Stamp, Netmedia’s BX-24, Phidgets, and MIT’s Handyboard, have comparable capabilities. All of these technologies simplify microcontroller programming by hiding the nitty-gritty intricacies in plain sight [2]. As an added bonus, Arduino provides several advantages over competing microcontroller systems for instructors, students, and curious hobbyists.
Program code
#include LiquidCrystallcd(7,6,5,4,3,2); inttempPin = A1; // the output pin of LM35 int fan = 11; // the pin where fan is int led = 8; // led pin int temp; inttempMin = 30; // the temperature to start the fan inttempMax = 70; // the maximum temperature when fan is at 100% intfanSpeed; intfanLCD; void setup() { pinMode(fan, OUTPUT); pinMode(led, OUTPUT); pinMode(tempPin, INPUT); lcd.begin(16,2); }
void loop() { temp = readTemp(); // get the temperature if(temp
} if((temp >= tempMin) && (temp <= tempMax)) { // if temperature is higher than minimum temp fanSpeed = map(temp, tempMin, tempMax, 32, 255); // the actual speed of fan fanLCD = map(temp, tempMin, tempMax, 0, 100); // speed of fan to display on LCD analogWrite(fan, fanSpeed); // spin the fan at the fanSpeed speed } if(temp >tempMax) { // if temp is higher than tempMax digitalWrite(led, HIGH); // turn on led } else { // else turn of led digitalWrite(led, LOW); } lcd.print(“TEMP: “); lcd.print(temp); // display the temperature lcd.print(“C “); lcd.setCursor(0,1); // move cursor to next line lcd.print(“FANS: “); lcd.print(fanLCD); // display the fan speed lcd.print(“%”); delay(200); lcd.clear(); }
intreadTemp() { // get the temperature and convert it to celsius temp = analogRead(tempPin); return temp * 0.48828125; }
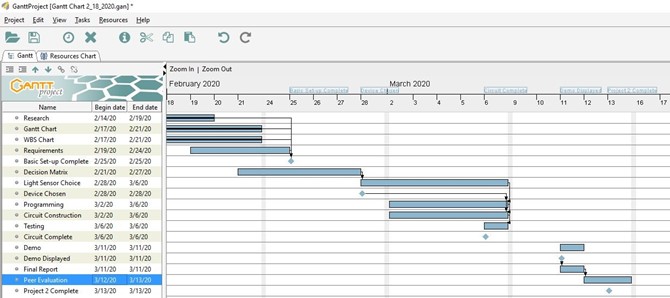
Figure 3: Initial Gantt chart
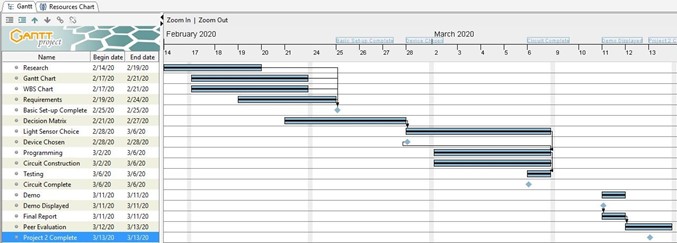
Figure 4: Final Gantt chart
We made no modifications to our Final Gantt Chart in comparison to the original [4]. The main difference between the original and final charts is that our final version achieved 100% fulfillment of all goals [4]. Please note that the Peer Evaluation has also been recorded as 100 percent complete in anticipation of the project’s completion, and has been declared as such solely since the due date has passed the date of the Final Report.
Discussion
To show the current temperature and fan speed, I added an LCD shield, although the circuit works just fine without it [1]. The transistor you choose will also be determined by the kind of fan you employ. The fan and transistor were powered by a 9V battery and the well-known BD139 transistor [1]. The Arduino board provides 5V for the LM35 temperature sensor and red LED. As you can see in the first line of the program, I’ve included the LiquidCrystal library (header), which has functions helpful for using an LCD with an Arduino board [2]. The sensor, led, and fan all have their pins set. Set your target temperatures for the variables temp Min and temp Max [2]. Heater temperatures are measured in degrees Fahrenheit (F) and are expressed in degrees Celsius (C). The minimum temperature is measured in C and the highest temperature is expressed in C (C). In other words, if you set the temperature minimum at 30 degrees and maximum at 35 degrees, the fan will begin spinning at 30 degrees and reach its maximum speed at 35 degrees [2]. In the temp variable, we keep track of the current temperature. Then, using some if () methods, we determine whether temp is lower than tempMin, in which case the fan should be off (LOW). This if () checks to see whether temperature is greater than the minTemp and lower than the tempMax, and if it is, the map () method is used to convert the temperature value from one type to another [3]. When the temperature is 32°F, the fanSpeed will be 255°F [3]. With the help of PWM and the analog Write, these numbers are utilized to regulate the fan’s speed (). LM35 temperature is directly proportional to fan speed, which is shown on the fan’s LCD as a numeric value ranging from 0 to 100 percent [3]. Even if the temperature rises over tempMax, the fan will spin at its maximum speed when the temperature hits the preset setting in tempMax.
References
Satoh. F, Itakura. M, “Cloud-based Infrastructure for Managing and Analyzing Environmental Resources”, SRII Global Conference, pp.325- 334, 201.
Kurschl. W, Beer W, “Combining cloud computing and wireless sensor networks”, International Conference on Information Integration and Web-based Applications and Services, pp.512-518, 2009. Zhengtong. Y, Wenfeng. Z, “The research of environmental pollution examination system based on the Cloud Computing”, International Conference on Communication Software and Networks, pp.514-516, 2011.
Montgomery. K, Chiang. K, “A New Paradigm for Integrated Environmental Monitoring”, ACM International Conference Proceeding Series, 2010.
Wei. Q, Jin. N, Lou X, Ma. R, Xu. J, “Software design for water environment remote monitoring system based on mobile devices”, Applied Mechanics and Materials, pp. 2027-2032, 2011

Time is precious
don’t waste it!

Plagiarism-free
guarantee

Privacy
guarantee

Secure
checkout

Money back
guarantee


