 All papers examples
Disciplines

- MLA
- APA
- Master's
- Undergraduate
- High School
- PhD
- Harvard
- Biology
- Art
- Drama
- Movies
- Theatre
- Painting
- Music
- Architecture
- Dance
- Design
- History
- American History
- Asian History
- Literature
- Antique Literature
- American Literature
- Asian Literature
- Classic English Literature
- World Literature
- Creative Writing
- English
- Linguistics
- Law
- Criminal Justice
- Legal Issues
- Ethics
- Philosophy
- Religion
- Theology
- Anthropology
- Archaeology
- Economics
- Tourism
- Political Science
- World Affairs
- Psychology
- Sociology
- African-American Studies
- East European Studies
- Latin-American Studies
- Native-American Studies
- West European Studies
- Family and Consumer Science
- Social Issues
- Women and Gender Studies
- Social Work
- Natural Sciences
- Anatomy
- Zoology
- Ecology
- Chemistry
- Pharmacology
- Earth science
- Geography
- Geology
- Astronomy
- Physics
- Agriculture
- Agricultural Studies
- Computer Science
- Internet
- IT Management
- Web Design
- Mathematics
- Business
- Accounting
- Finance
- Investments
- Logistics
- Trade
- Management
- Marketing
- Engineering and Technology
- Engineering
- Technology
- Aeronautics
- Aviation
- Medicine and Health
- Alternative Medicine
- Healthcare
- Nursing
- Nutrition
- Communications and Media
- Advertising
- Communication Strategies
- Journalism
- Public Relations
- Education
- Educational Theories
- Pedagogy
- Teacher's Career
- Statistics
- Chicago/Turabian
- Nature
- Company Analysis
- Sport
- Paintings
- E-commerce
- Holocaust
- Education Theories
- Fashion
- Shakespeare
- Canadian Studies
- Science
- Food Safety
- Relation of Global Warming and Extreme Weather Condition
Paper Types

- Movie Review
- Essay
- Admission Essay
- Annotated Bibliography
- Application Essay
- Article Critique
- Article Review
- Article Writing
- Assessment
- Book Review
- Business Plan
- Business Proposal
- Capstone Project
- Case Study
- Coursework
- Cover Letter
- Creative Essay
- Dissertation
- Dissertation - Abstract
- Dissertation - Conclusion
- Dissertation - Discussion
- Dissertation - Hypothesis
- Dissertation - Introduction
- Dissertation - Literature
- Dissertation - Methodology
- Dissertation - Results
- GCSE Coursework
- Grant Proposal
- Admission Essay
- Annotated Bibliography
- Application Essay
- Article
- Article Critique
- Article Review
- Article Writing
- Assessment
- Book Review
- Business Plan
- Business Proposal
- Capstone Project
- Case Study
- Coursework
- Cover Letter
- Creative Essay
- Dissertation
- Dissertation - Abstract
- Dissertation - Conclusion
- Dissertation - Discussion
- Dissertation - Hypothesis
- Dissertation - Introduction
- Dissertation - Literature
- Dissertation - Methodology
- Dissertation - Results
- Essay
- GCSE Coursework
- Grant Proposal
- Interview
- Lab Report
- Literature Review
- Marketing Plan
- Math Problem
- Movie Analysis
- Movie Review
- Multiple Choice Quiz
- Online Quiz
- Outline
- Personal Statement
- Poem
- Power Point Presentation
- Power Point Presentation With Speaker Notes
- Questionnaire
- Quiz
- Reaction Paper
- Research Paper
- Research Proposal
- Resume
- Speech
- Statistics problem
- SWOT analysis
- Term Paper
- Thesis Paper
- Accounting
- Advertising
- Aeronautics
- African-American Studies
- Agricultural Studies
- Agriculture
- Alternative Medicine
- American History
- American Literature
- Anatomy
- Anthropology
- Antique Literature
- APA
- Archaeology
- Architecture
- Art
- Asian History
- Asian Literature
- Astronomy
- Aviation
- Biology
- Business
- Canadian Studies
- Chemistry
- Chicago/Turabian
- Classic English Literature
- Communication Strategies
- Communications and Media
- Company Analysis
- Computer Science
- Creative Writing
- Criminal Justice
- Dance
- Design
- Drama
- E-commerce
- Earth science
- East European Studies
- Ecology
- Economics
- Education
- Education Theories
- Educational Theories
- Engineering
- Engineering and Technology
- English
- Ethics
- Family and Consumer Science
- Fashion
- Finance
- Food Safety
- Geography
- Geology
- Harvard
- Healthcare
- High School
- History
- Holocaust
- Internet
- Investments
- IT Management
- Journalism
- Latin-American Studies
- Law
- Legal Issues
- Linguistics
- Literature
- Logistics
- Management
- Marketing
- Master's
- Mathematics
- Medicine and Health
- MLA
- Movies
- Music
- Native-American Studies
- Natural Sciences
- Nature
- Nursing
- Nutrition
- Painting
- Paintings
- Pedagogy
- Pharmacology
- PhD
- Philosophy
- Physics
- Political Science
- Psychology
- Public Relations
- Relation of Global Warming and Extreme Weather Condition
- Religion
- Science
- Shakespeare
- Social Issues
- Social Work
- Sociology
- Sport
- Statistics
- Teacher's Career
- Technology
- Theatre
- Theology
- Tourism
- Trade
- Undergraduate
- Web Design
- West European Studies
- Women and Gender Studies
- World Affairs
- World Literature
- Zoology
The Hours of TV Watched vs. GPA, Lab Report Example
Hire a Writer for Custom Lab Report
Use 10% Off Discount: "custom10" in 1 Click 👇
You are free to use it as an inspiration or a source for your own work.

Introduction
The unproven consensus is students that watch too much TV at home will have lower grades that students that watch less TV. In the new millennium, students spend more time using the TV as a tool for leisure, educational and extracurricular activities. The studies can be deceptive because the environment is based on using TV as a mode of learning for movies, videos, online classrooms, banking online, banking use mobile phone, video conferencing using TV and watching TV at home or using mobile phone. The relationship between hours students are watching TV and their academic performance has some supporting studies for both groups. There are studies that indicated that students that spend less time watching TV has been academic grades. However, there are students that indicate that students that has more extra activities besides TV such as band, sports or music have been academic grades. The argument can be made that the combination of several activities including TV make the student more rounded thus they receive better academic grades. However, the analysis can be tricky because the terminology can change the meaning of the results. According to Kimiko (2014) reported that “more time in extracurricular activities and structured groups and less time watching TV are associated with higher test scores and school grades” (Para. 15). The key word is extracurricular activities which this study does not specifically indicate watching TV as an extracurricular activity. In addition, the students watching TV is considered more of a leisure activity. The trend is different today, because our current society is immersed in TV, Cable, electronics and advertisement to receive information from all over the planet. The TV has become the main console to education, learning and receiving daily news. The paper will determine if there is any correlation significance to students watching TV and high student’s academic grades.
Independent and Dependent Variables
An independent variable is exactly what it sounds like. It is a variable that stands alone and isn’t changed by the other variables you are trying to measure. However, it was difficult to determine which was dependent and which was independent. However, the theory is to put the variables in a sentence to see which one makes more sense.
Summary
In this case, the amount of time spent watching TV causes a change in a high school students academic Grade Point Average (GPA). The GPA average is independent variable and the number of hours a day watching TV is a dependent variable (table 1)
Table 1

Mean, Median and Mode
The mean is the descriptive statistic most often used to describe the central tendency of a group of measurements.
Summary
The mean or central tendency for the “GPA” was 2.8770. The median was 2.8950 and the mode was 1.5. (table 3) The mean or central tendency for the “ hours” is 2.6815. The median is 2.4250 and the mode is 1.80. (Table 2).
Table 2

Table 3

Scatter plot A versus B or B versus A (without any regression)
Summary
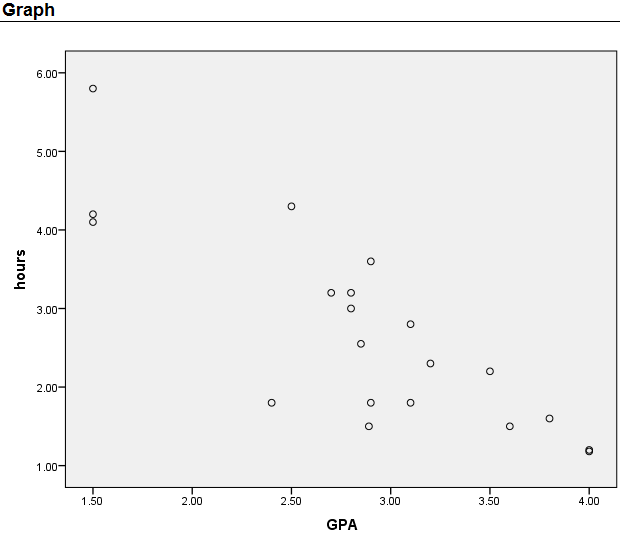
Scatter Plots (also called scatter diagrams) are used to investigate the possible relationship between two variables that both relate to the same “event.” A straight line of best fit (using the least squares method) is often included (para 3).The graph indicates this is a weak association of the data along with the outliers. It’s necessary not to make any judgments too quickly with outliers that may skew the data. However, it must be notated that the outlier exist.
Summary
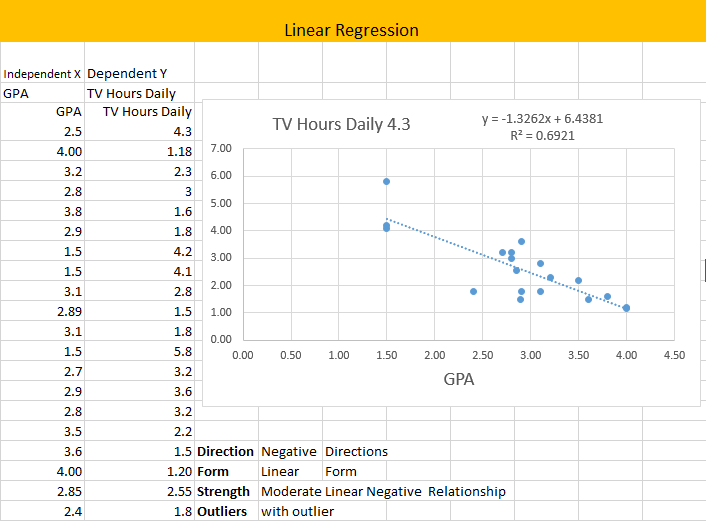
The summary is based on negative or positive, form, liner or non-linear and strength. The direction is negative relationship meaning as the independent variable increases (GPA) and dependent variables (TV) decreases. The scatter plot also indicates that the form is non-linear. The data is spread out without creating a linear line. The strength has a weak negatively linear relationship. (graph 4)
Graph 4
Graph the regression curve on the scatter plot
Graph 5
Regressions
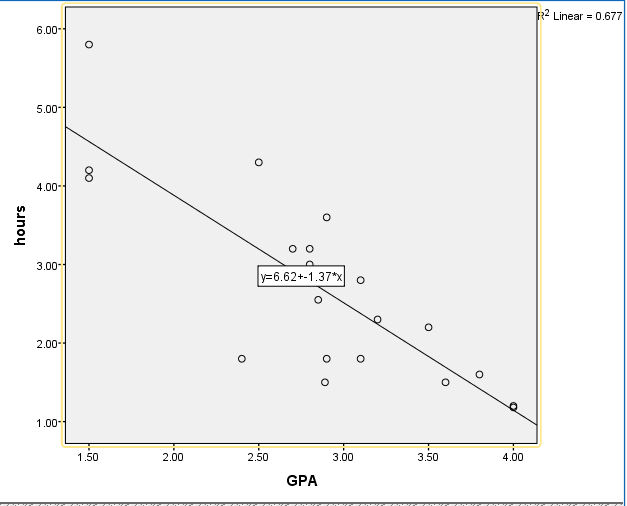
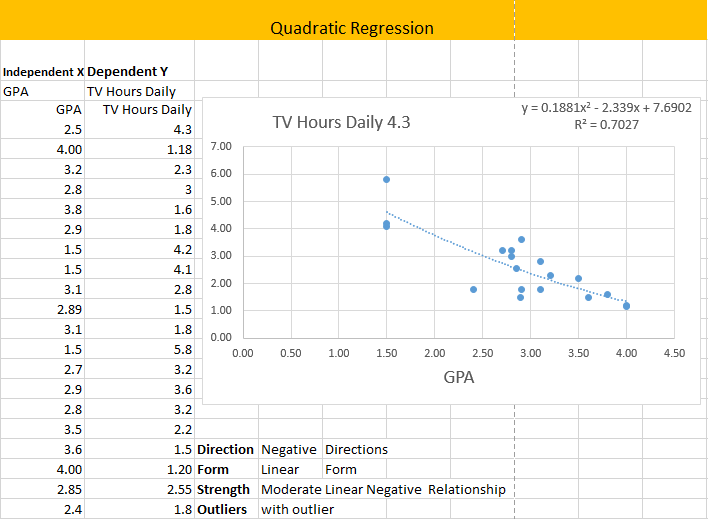
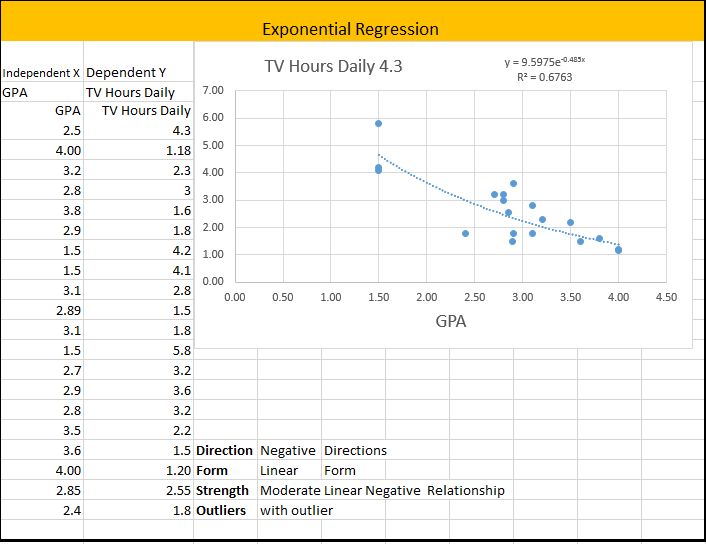
The best way to calculate or analyze the regression for the student and TV theory, the IBM SPSS analytical software was used to calculate three different regressions which are linear, quadratic and exponential. From the regressions I will decide, according to the highest R2, which model is best for the data?
- The quadratic model is R2=70279(graph 6)
- The exponential model is R2=6763 (graph 7)
- The linear model is R2=6961 (graph 8)
Graph 6
Graph 7
Graph 8
Chi-squared test for Independence
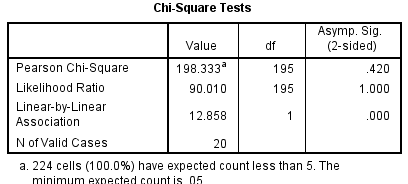
The Chi-squared test for Independence which is also known as the cross-tabulation test using IBM SPSS analytical software. The Chi-square test is intended to test how likely it is that an observed distribution is due to chance. It is also called a “goodness of fit” statistic, because it measures how well the observed distribution of data fits with the distribution that is expected if the variables are independent (para 1). The conditions has been meet there is independent and dependent categories.
Summary
In the analysis, we performed a 2 by 2 Cross Tabulation. Here are the assumptions: The students are form an independent random sample, we two variables we want to compare which are Number of hours students watch TV and GPA. The GPA is the independent variable and the hours are the dependent variables. We are testing to determine if the Number of hours of students that watch TV can impact a student’s GPA. Our null hypothesis is if the “P” value is greater than .05 we are going to accept the null hypothesis and if “P” value is less than .05 we going to reject the null hypothesis. The Chi-Square Test results indicated that “P” is less that .05 therefore we are going to reject the null. This means there is a significantly difference between students watching TV and GPA. The table 9 is the Cross tabulation and (table 10) Chi-Square Test
Table 9

Table 10
Limitations
The future test could have more variables such as students GPA in elementary, high school and college. This test could analyze the data over a longer period of time. The future test should be divided the data between how many hours were leisure for the student. This means the student was not using the TV for anything educational and the second variable would be another category for extracurricular. This would define the time spent watching TV between these two variables.
Bibliography
Ling, U. (2008). Tutorial: Pearson’s Chi-square Test for Independence. Retrieved from http://www.ling.upenn.edu/~clight/chisquared.htm
Kimiko.F. (2014). The effects of extracurricular activities on the academic performance of junior high students. Retrieved from http://www.kon.org/urc/v5/fujita.html
Skymark. (2013).Scatterplots. Retrieved from http://www.skymark.com/resources/tools/scatter_plots.asp

Stuck with your Lab Report?
Get in touch with one of our experts for instant help!

Time is precious
don’t waste it!
writing help!


Plagiarism-free
guarantee

Privacy
guarantee

Secure
checkout

Money back
guarantee

