 All papers examples
Disciplines

- MLA
- APA
- Master's
- Undergraduate
- High School
- PhD
- Harvard
- Biology
- Art
- Drama
- Movies
- Theatre
- Painting
- Music
- Architecture
- Dance
- Design
- History
- American History
- Asian History
- Literature
- Antique Literature
- American Literature
- Asian Literature
- Classic English Literature
- World Literature
- Creative Writing
- English
- Linguistics
- Law
- Criminal Justice
- Legal Issues
- Ethics
- Philosophy
- Religion
- Theology
- Anthropology
- Archaeology
- Economics
- Tourism
- Political Science
- World Affairs
- Psychology
- Sociology
- African-American Studies
- East European Studies
- Latin-American Studies
- Native-American Studies
- West European Studies
- Family and Consumer Science
- Social Issues
- Women and Gender Studies
- Social Work
- Natural Sciences
- Anatomy
- Zoology
- Ecology
- Chemistry
- Pharmacology
- Earth science
- Geography
- Geology
- Astronomy
- Physics
- Agriculture
- Agricultural Studies
- Computer Science
- Internet
- IT Management
- Web Design
- Mathematics
- Business
- Accounting
- Finance
- Investments
- Logistics
- Trade
- Management
- Marketing
- Engineering and Technology
- Engineering
- Technology
- Aeronautics
- Aviation
- Medicine and Health
- Alternative Medicine
- Healthcare
- Nursing
- Nutrition
- Communications and Media
- Advertising
- Communication Strategies
- Journalism
- Public Relations
- Education
- Educational Theories
- Pedagogy
- Teacher's Career
- Statistics
- Chicago/Turabian
- Nature
- Company Analysis
- Sport
- Paintings
- E-commerce
- Holocaust
- Education Theories
- Fashion
- Shakespeare
- Canadian Studies
- Science
- Food Safety
- Relation of Global Warming and Extreme Weather Condition
Paper Types

- Movie Review
- Essay
- Admission Essay
- Annotated Bibliography
- Application Essay
- Article Critique
- Article Review
- Article Writing
- Assessment
- Book Review
- Business Plan
- Business Proposal
- Capstone Project
- Case Study
- Coursework
- Cover Letter
- Creative Essay
- Dissertation
- Dissertation - Abstract
- Dissertation - Conclusion
- Dissertation - Discussion
- Dissertation - Hypothesis
- Dissertation - Introduction
- Dissertation - Literature
- Dissertation - Methodology
- Dissertation - Results
- GCSE Coursework
- Grant Proposal
- Admission Essay
- Annotated Bibliography
- Application Essay
- Article
- Article Critique
- Article Review
- Article Writing
- Assessment
- Book Review
- Business Plan
- Business Proposal
- Capstone Project
- Case Study
- Coursework
- Cover Letter
- Creative Essay
- Dissertation
- Dissertation - Abstract
- Dissertation - Conclusion
- Dissertation - Discussion
- Dissertation - Hypothesis
- Dissertation - Introduction
- Dissertation - Literature
- Dissertation - Methodology
- Dissertation - Results
- Essay
- GCSE Coursework
- Grant Proposal
- Interview
- Lab Report
- Literature Review
- Marketing Plan
- Math Problem
- Movie Analysis
- Movie Review
- Multiple Choice Quiz
- Online Quiz
- Outline
- Personal Statement
- Poem
- Power Point Presentation
- Power Point Presentation With Speaker Notes
- Questionnaire
- Quiz
- Reaction Paper
- Research Paper
- Research Proposal
- Resume
- Speech
- Statistics problem
- SWOT analysis
- Term Paper
- Thesis Paper
- Accounting
- Advertising
- Aeronautics
- African-American Studies
- Agricultural Studies
- Agriculture
- Alternative Medicine
- American History
- American Literature
- Anatomy
- Anthropology
- Antique Literature
- APA
- Archaeology
- Architecture
- Art
- Asian History
- Asian Literature
- Astronomy
- Aviation
- Biology
- Business
- Canadian Studies
- Chemistry
- Chicago/Turabian
- Classic English Literature
- Communication Strategies
- Communications and Media
- Company Analysis
- Computer Science
- Creative Writing
- Criminal Justice
- Dance
- Design
- Drama
- E-commerce
- Earth science
- East European Studies
- Ecology
- Economics
- Education
- Education Theories
- Educational Theories
- Engineering
- Engineering and Technology
- English
- Ethics
- Family and Consumer Science
- Fashion
- Finance
- Food Safety
- Geography
- Geology
- Harvard
- Healthcare
- High School
- History
- Holocaust
- Internet
- Investments
- IT Management
- Journalism
- Latin-American Studies
- Law
- Legal Issues
- Linguistics
- Literature
- Logistics
- Management
- Marketing
- Master's
- Mathematics
- Medicine and Health
- MLA
- Movies
- Music
- Native-American Studies
- Natural Sciences
- Nature
- Nursing
- Nutrition
- Painting
- Paintings
- Pedagogy
- Pharmacology
- PhD
- Philosophy
- Physics
- Political Science
- Psychology
- Public Relations
- Relation of Global Warming and Extreme Weather Condition
- Religion
- Science
- Shakespeare
- Social Issues
- Social Work
- Sociology
- Sport
- Statistics
- Teacher's Career
- Technology
- Theatre
- Theology
- Tourism
- Trade
- Undergraduate
- Web Design
- West European Studies
- Women and Gender Studies
- World Affairs
- World Literature
- Zoology
The SPSS Analysis Report, Statistics Problem Example
Hire a Writer for Custom Statistics problem
Use 10% Off Discount: "custom10" in 1 Click 👇
You are free to use it as an inspiration or a source for your own work.

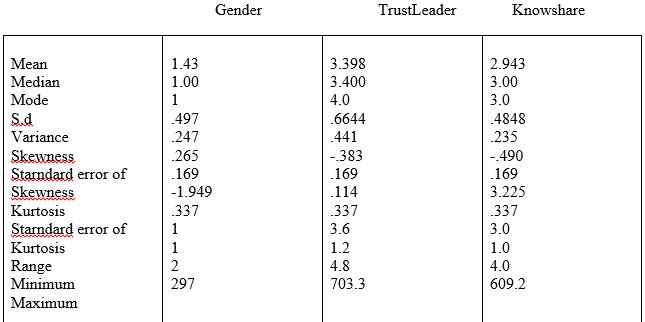
The descriptive statistics of gender, Trustleader, and Knowshare involves the following bellow.
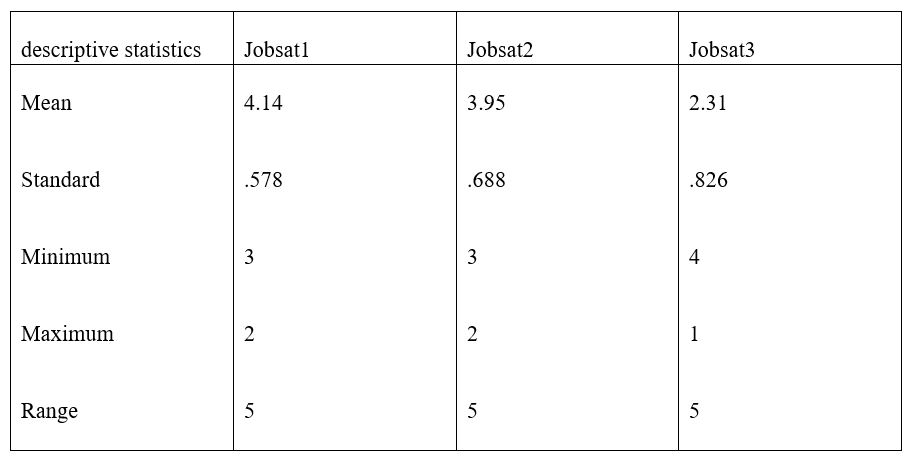
The descriptive statistics, mean, standard deviation, minimum, maximum and the range for the overall job satisfaction.
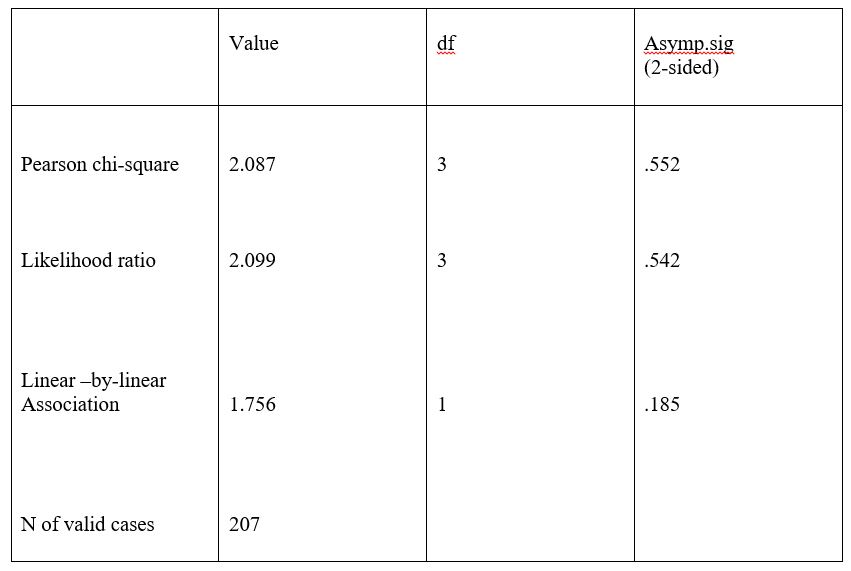
The analysis of the association of age with gender
The association between variables is tested using the chi-square test. The Pearson chi-square value acts as a comparison value to the level of significance. When the Pearson chi-square value is less than the level of significance, the association is real but if the Pearson chi-square value is more than the level of significance then the is no association. Often, the level of significance equals to 0.05.
After running the analysis the p-value =0.552 which is more than the level of significance (0.05). Therefore the is no association between the age and the gender
Chi-square test
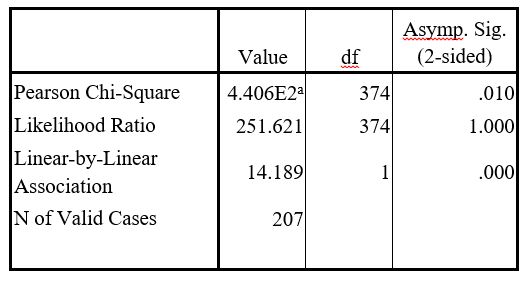
The analysis of the association between trust in one’s supervisor and the sharing knowledge with one’s supervisor. This obtained by running analysis on the chi-square to ascertain the association or independence between the trust and knowledge of one’s supervisor.
Null hypothesis: There is relationship
Alternative hypothesis: There is no relationship
When the Pearson chi-square value is less than the 0.05 the null hypothesis is correct otherwise the Alternative hypothesis is correct when Pearson chi-square value is more than 0.05. The results of the analysis are.
Chi-Square Tests
Conclusion
The Pearson Chi-Square value is 0.01. Compared to the 0.05 the null hypothesis is correct. Therefore from the analysis there is a positive association between the trust in one’s supervisor and the sharing knowledge with one’s supervisor. The test is a two tailed example.
Analysis testing that the males have higher levels of performance than the females. The test is descriptive, custom tables provide a perfect comparative analysis between the performance of males and the females by comparing their respective mean performance. When the mean performance of males is higher than for the females it shows that it is has higher performance and the vice visor. The tests reveal mean performance of 3.8 and 3.7 for males and females respectively.
Male performance (3.8)> Female performance (3.7), this quantify the above statement that the males have the higher levels of performance than the females.
Custom Tables
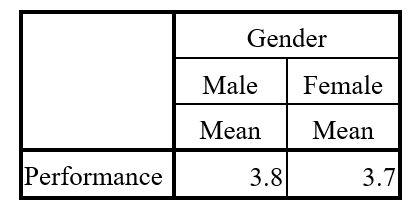
The test above is one tailed hypothesis
An analysis to examine if the four age groups differ in terms of the trusting their supervisors and their equality of variances.
Running through mean comparison, analysis includes a report, ANOVA and the measures of association. Two hypotheses are,
Null hypotheses: all age groups differ
Alternative hypotheses: groups are same
When the analysis is run through ANOVA method, the relationship between the level of significance, which is 0.05 and the computed value of significance dictates the decision on the hypothesis. When the computed value of significance is less than the tabulated significant value, all the age groups are differ in terms of trust otherwise all groups same
The above analysis is as follows
ANOVA Tables

Computed significant value = 0.000, this is less than 0.05, satisfying the null hypotheses that all the age groups differ in terms of trust. The conclusion is under the support of the report below:
Report
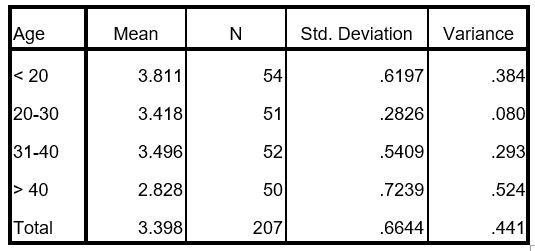
The difference in the means in the above report, verify the conclusion that all age groups differ in terms of trust. The report and the levene’s test of equality of variance below show that the age groups differ in the variances.
Test of Homogeneity of Variances

Analysis testing the hypotheses that trust and sharing knowledge with one’s have unique effect on the job performance. ANOVA is the best way of testing the above analysis. The results from the ANOVA test include the following
ANOVA
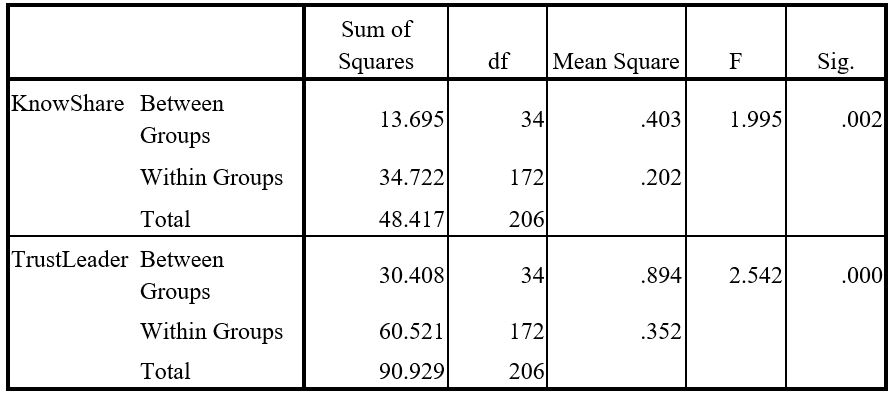
Null hypotheses: Trust and sharing knowledge have unique effects on the job performance, while Alternative hypotheses: Trust and sharing knowledge do not have unique effects on the job performance.
After running through ANOVA the test reveals that both the significance of the F’s are less than the level of significance=0.05.When computed level of significance is less than the tabulated, the test accept the null hypotheses that the trust and sharing knowledge have unique effects on the job performance.
The computed significance value of know Share and trust leader are 0.02 and 0.00 respectively. This confirms the test that the above effects are ungues.
The two effects of the trust and the sharing knowledge have unique effects but they differ in the uniqueness. The value of the computed significance value of knowShare and trustleader explains more about a better predictor of the job performance. From the above results, 0.00<0.02, Where the computed value of significance of trustleader is less than the computed value of significance of the knowshare then trusting one’s supervisor is a better predictor of job performance than sharing knowledge with the supervisors.
An analysis testing the hypotheses that sharing knowledge with the supervisor mediates the relationship between trust in one’s supervisor and the job performance. ANOVA is best in the above analysis, keeping the sharing knowledge variable to be a controlling factor of both trust and the job performance. The results of the above analysis are:
ANOVA
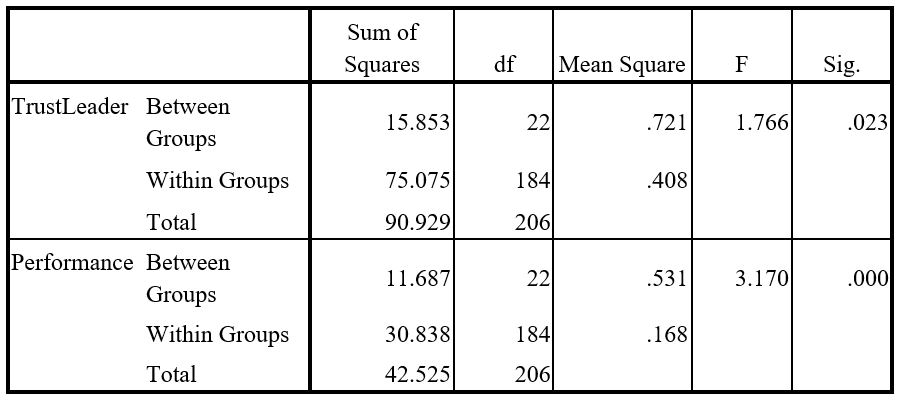
When the sharing of the knowledge variable mediates the relationship between the trust in one’s supervisor and the job performance, the results test the hypotheses bellow
Null hypotheses: Sharing of the knowledge mediates the relationship between trust and the job performance, while Alternative hypotheses: Sharing of the knowledge do not mediates the relationship between the trust and the job performance.
The value of the computed significance value of trustleader and the job performance explains more about sharing knowledge as a mediator to the relationship between trust in one’s supervisor and the job performance about.
Both the computed significance value of the trust in one’s supervisor and the job performance when sharing of knowledge mediates the relationship between trust in one’s supervisor and the job performance are significant (both 0.023 and 0.000 < 0.05) and therefore the null hypotheses is true that sharing of knowledge mediates the relationship between trust in one’s supervisor and the job performance.
Analysis testing the need for achievement as a moderator to the relationship between the trust in one’s supervisor and the knowledge sharing with immediate supervisor. The ANOVA results are as follow:
ANOVA
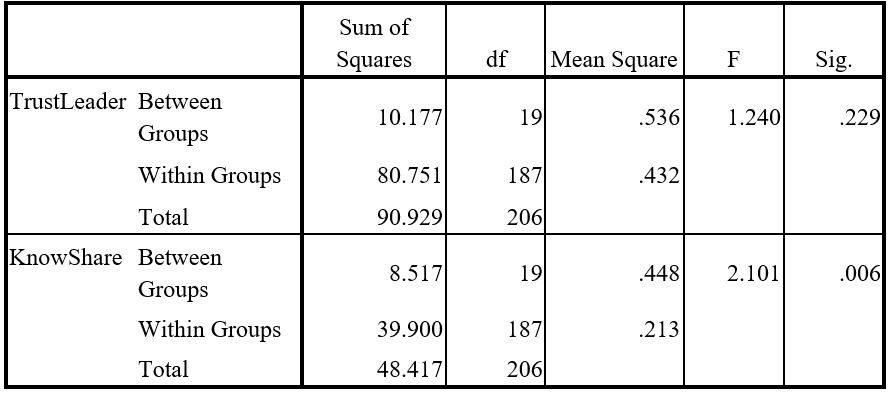
Null hypothesis: Need for achievement moderates both the trust in one’s supervisor and the sharing of knowledge with the immediate supervisor, while
Alternative hypothesis: Need for achievement does not moderate both the trust in one’s supervisor and the sharing of knowledge with the immediate supervisor.
From the analysis results, p-value of the trust in one’s supervisor =0.229>0.05, hence satisfying the fact that the need for achievement does not moderate the trust in one’s supervisor, but it moderates the sharing of the knowledge with the immediate supervisor because it’s p-value=0.006<0.05.

Stuck with your Statistics problem?
Get in touch with one of our experts for instant help!

Time is precious
don’t waste it!
writing help!


Plagiarism-free
guarantee

Privacy
guarantee

Secure
checkout

Money back
guarantee

