 All papers examples
Disciplines

- MLA
- APA
- Master's
- Undergraduate
- High School
- PhD
- Harvard
- Biology
- Art
- Drama
- Movies
- Theatre
- Painting
- Music
- Architecture
- Dance
- Design
- History
- American History
- Asian History
- Literature
- Antique Literature
- American Literature
- Asian Literature
- Classic English Literature
- World Literature
- Creative Writing
- English
- Linguistics
- Law
- Criminal Justice
- Legal Issues
- Ethics
- Philosophy
- Religion
- Theology
- Anthropology
- Archaeology
- Economics
- Tourism
- Political Science
- World Affairs
- Psychology
- Sociology
- African-American Studies
- East European Studies
- Latin-American Studies
- Native-American Studies
- West European Studies
- Family and Consumer Science
- Social Issues
- Women and Gender Studies
- Social Work
- Natural Sciences
- Anatomy
- Zoology
- Ecology
- Chemistry
- Pharmacology
- Earth science
- Geography
- Geology
- Astronomy
- Physics
- Agriculture
- Agricultural Studies
- Computer Science
- Internet
- IT Management
- Web Design
- Mathematics
- Business
- Accounting
- Finance
- Investments
- Logistics
- Trade
- Management
- Marketing
- Engineering and Technology
- Engineering
- Technology
- Aeronautics
- Aviation
- Medicine and Health
- Alternative Medicine
- Healthcare
- Nursing
- Nutrition
- Communications and Media
- Advertising
- Communication Strategies
- Journalism
- Public Relations
- Education
- Educational Theories
- Pedagogy
- Teacher's Career
- Statistics
- Chicago/Turabian
- Nature
- Company Analysis
- Sport
- Paintings
- E-commerce
- Holocaust
- Education Theories
- Fashion
- Shakespeare
- Canadian Studies
- Science
- Food Safety
- Relation of Global Warming and Extreme Weather Condition
Paper Types

- Movie Review
- Essay
- Admission Essay
- Annotated Bibliography
- Application Essay
- Article Critique
- Article Review
- Article Writing
- Assessment
- Book Review
- Business Plan
- Business Proposal
- Capstone Project
- Case Study
- Coursework
- Cover Letter
- Creative Essay
- Dissertation
- Dissertation - Abstract
- Dissertation - Conclusion
- Dissertation - Discussion
- Dissertation - Hypothesis
- Dissertation - Introduction
- Dissertation - Literature
- Dissertation - Methodology
- Dissertation - Results
- GCSE Coursework
- Grant Proposal
- Admission Essay
- Annotated Bibliography
- Application Essay
- Article
- Article Critique
- Article Review
- Article Writing
- Assessment
- Book Review
- Business Plan
- Business Proposal
- Capstone Project
- Case Study
- Coursework
- Cover Letter
- Creative Essay
- Dissertation
- Dissertation - Abstract
- Dissertation - Conclusion
- Dissertation - Discussion
- Dissertation - Hypothesis
- Dissertation - Introduction
- Dissertation - Literature
- Dissertation - Methodology
- Dissertation - Results
- Essay
- GCSE Coursework
- Grant Proposal
- Interview
- Lab Report
- Literature Review
- Marketing Plan
- Math Problem
- Movie Analysis
- Movie Review
- Multiple Choice Quiz
- Online Quiz
- Outline
- Personal Statement
- Poem
- Power Point Presentation
- Power Point Presentation With Speaker Notes
- Questionnaire
- Quiz
- Reaction Paper
- Research Paper
- Research Proposal
- Resume
- Speech
- Statistics problem
- SWOT analysis
- Term Paper
- Thesis Paper
- Accounting
- Advertising
- Aeronautics
- African-American Studies
- Agricultural Studies
- Agriculture
- Alternative Medicine
- American History
- American Literature
- Anatomy
- Anthropology
- Antique Literature
- APA
- Archaeology
- Architecture
- Art
- Asian History
- Asian Literature
- Astronomy
- Aviation
- Biology
- Business
- Canadian Studies
- Chemistry
- Chicago/Turabian
- Classic English Literature
- Communication Strategies
- Communications and Media
- Company Analysis
- Computer Science
- Creative Writing
- Criminal Justice
- Dance
- Design
- Drama
- E-commerce
- Earth science
- East European Studies
- Ecology
- Economics
- Education
- Education Theories
- Educational Theories
- Engineering
- Engineering and Technology
- English
- Ethics
- Family and Consumer Science
- Fashion
- Finance
- Food Safety
- Geography
- Geology
- Harvard
- Healthcare
- High School
- History
- Holocaust
- Internet
- Investments
- IT Management
- Journalism
- Latin-American Studies
- Law
- Legal Issues
- Linguistics
- Literature
- Logistics
- Management
- Marketing
- Master's
- Mathematics
- Medicine and Health
- MLA
- Movies
- Music
- Native-American Studies
- Natural Sciences
- Nature
- Nursing
- Nutrition
- Painting
- Paintings
- Pedagogy
- Pharmacology
- PhD
- Philosophy
- Physics
- Political Science
- Psychology
- Public Relations
- Relation of Global Warming and Extreme Weather Condition
- Religion
- Science
- Shakespeare
- Social Issues
- Social Work
- Sociology
- Sport
- Statistics
- Teacher's Career
- Technology
- Theatre
- Theology
- Tourism
- Trade
- Undergraduate
- Web Design
- West European Studies
- Women and Gender Studies
- World Affairs
- World Literature
- Zoology
Bacterial Growth, Lab Report Example
Hire a Writer for Custom Lab Report
Use 10% Off Discount: "custom10" in 1 Click 👇
You are free to use it as an inspiration or a source for your own work.

Analyzing the Effect of Temperature and Nutrient Concentration on the Rate and Yield Factor of Escherichia Coli on a Liquid Culture
Introduction
Cultured in a liquid medium, the Escherichia coli bacteria is known to shown phases of a steady growth, a slowed down growth phase, followed by stagnation with its peak yield, and lastly, with the death phase. In observing the growth phase of the E.Coli bacteria, two particular factors are measured and determined namely the log phase representing the maximal growth rate achieved by the culture and the yield which is the maximal cell density achieved at the end of log or the early stationary phase.
In culturing the said bacteria, the elements of temperature and nutrient available play a significant role in the growth phase and maximum yield of the said subject. As noted, the temperature significantly affects the growth rate as a slightly above room temperature level enhances faster growth while the nutrient influence the yield of the E.Coli culture. On general, the ideally temperature level for E.Coli is 37oC which is the normal body temperature of mammals and humans who are common breeding grounds of this bacteria (Nguyen, 2006, 88).
With consideration of the general growth behavior of the E.Coli bacteria, the initial hypothesis in this experiment was formulated stating that the lower temperature will result to same yield result however on lower growth rate. Likewise, high temperature can severely affect the yield and growth rate results as it will likely hasten the denaturation of enzymes in the culture of which the optimal temperature will likely fall on above room level namely on the 37oC mark. In the case of nutrient concentration, higher concentration will likely produce greater yield and faster rate of which it is expected that the culture with 25% NB will result only to ¼ of the yield from 100% NB samples.
Methods
Three flasks of 100% nutrient broth (NB) and three flasks of 25% NB were innoculated with E. coli. A 100% NB and a 25% NB culture were grown with aeration at one of three temperatures: 25C, 35C or 50C. The cell density of each culture was measured by absorbance (A600) readings using a spectrophotomer. Cells were grown from 0 to 52 hours and absorbance readings were collected from 1 mL samples harvested every 30 minutes for time frames: (2.5, 3, 3.5, and 4 hours). Measured data are gathered and compiled on different graphs highlighting the growth rate and yield for the two groups based on nutrient concentration with the three temperature range on each. Also, the data were plotted on a linear graph based on their log10absobance rate showing the different growth phases for each samples as compared with the others in different temperature range and their counterpart on nutrient concentration.
Result
Narrative
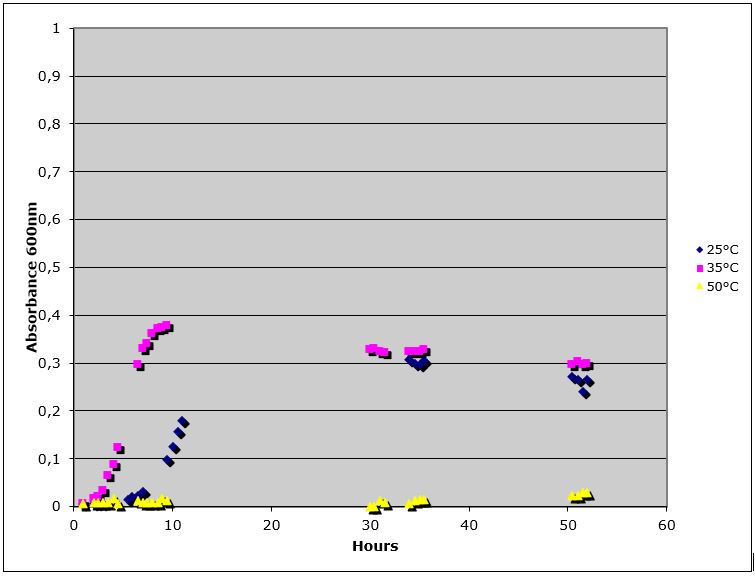
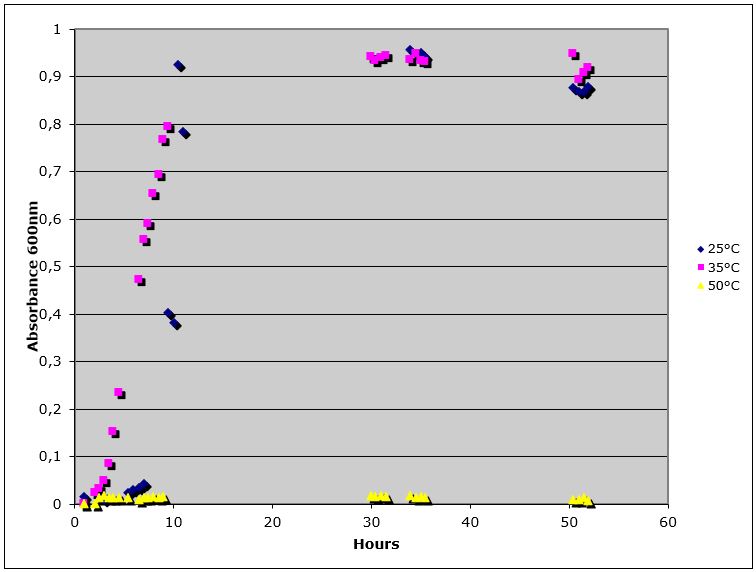
On the issue of growth phase, each of the six culture samples exhibited different results as influenced mainly by the different factors involved in each set. The samples from 35oC, both from 25% and 100% NB has shown a steady growth from the start to the first 10 hours of the observation compared with samples from 25oC which have shown slow and stagnated growth rate on the same period (Fig 1, Fig 2). Samples however from 50oC has failed to exhibit a realizable growth phase due to its low or rather insignicant log phase. Also, samples both from 25oC and 35oC can be said to mark a start of death phase with a significant decline in their growth rate however is still inconclusive due to lack of further data.
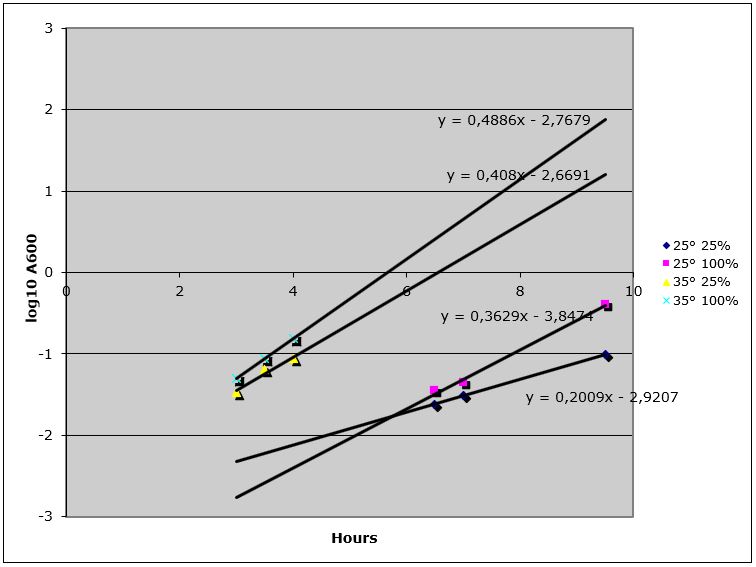
Considering the factor of temperature, its effect can be signfiicantly observed on the varying growth rate exhibited from the culture samples distributed on the three sets. Comparing samples from the 100% NB, culture on 35oC has shown the steepest log (Fig 3). On the point of yield, both samples from 35oC and 25oC have shown almost equal results. The samples from 25% NB have shown likely similar results from their counterpart set in terms of growth rate yet their average yield is only a quater of the other group. The two samples from 50oC have exhibited a small and stagnant growth phase with low yield result.
Viewing the effects of the nutrient concentration, the culture with 100% NB placed on 35oC has shown the higher yield than its counterpart with only 25% yet with somewhat equivalent growth rate (Fig 3). Samples with 100% NB kept on 25oC likewise displayed similar comparison as with its partner with 25% NB. Thirdly, both samples with 100% and 25% NB placed at 50oC have shown low growth rate with low yield result.
Data Presentation

Figure 1. Raw absorbance of 25°C, 35°C, and 50°C flasks at 25% broth concentration versus time. The absorbance was measured every thirty minutes over a fifty-two hour time frame.

Figure 2. Raw absorbance of 25°C, 35°C, and 50°C flasks at 100% broth concentration versus time. The absorbance was measured every thirty minutes over a fifty-two hour time frame.

Figure 3. The log10 absorbance of the 25°C and 35°C temperature broths at selected times during the log phase. The times chosen for the 25°C broth were 6.5, 7 and 9 hours, while the 35°C broth times were 2.5, 3, 3.5 and 4 hours.
Table 1. Slopes of the trend lines for the 25°C and 35°C broths at the selected time intervals. The slope data was obtained from the trend lines in Figure 3.
| Substrates | Slope (m) of trend lines |
| 25% nutrient broth at 25°C | 0.2009 |
| 100% nutrient broth at 25°C | 0.3629 |
| 25% nutrient broth at 50°C | 0.408 |
| 100% nutrient broth at 50°C | 0.4886 |

Figure 4. The raw absorbance versus temperature of the three flasks at 34-35.5 hours and 50.5-52 hours. The mean absorbance in the two time frames was calculated for the three flasks.
Table 2. The mean absorbance of the 25% and 100% concentration flasks at the time points of 34-35.5 hours and 50.5-52 hours, and the p-values comparing the 25% and 100% concentrations flasks at each time point. The p-value was determined by performing a t-test for each of the time points.
| 25°C – 25% | 25°C – 100% | 35°C – 25% | 35°C – 100% | 50°C – 25% | 50°C – 100% | |
| Average 30-32 hours | 0.30225*
|
0.949*
|
0.32575
|
0.94025
|
0.00575
|
0.017
|
| Average 50.5-52 hours | 0.261
|
0.87375
|
0.29925
|
0.91625
|
0.0255
|
0.0095
|
| P-value | 0.002589874
|
1.09488E-06
|
1.42407E-05
|
0.058048183
|
0.001011528
|
0.00078574
|
*avg 34-35.5 hours versus 30-32 hours
Discussion
Considering the gathered facts and information from the conducted experiment, it can be said that the factors of temperature and nutrient indeed have a significant effect on the growth and yield of E.Coli bacteria. Indeed, the bacteria cells grown in the culture with 25% nutrient broth produced only 25% of the yield from 100% nutrient culture. This is seen with the comparison of the raw absorbance results from the two culture set in which those of 25% NB measured only an average of 0.3 while those of 100% NB resulted to an average of 0.9 to 1 absorbance rate. In terms of temperature factor, the optimal rate of 35oC indeed produced greater growth phase than those set on 25oC either on 25% NB or 100% NB.
Looking through the different growth phases from all culture samples, indeed the factor of temperature of caused a signficant variation on the results from the three sets. The cultures from 35oC marked a steady growth on their log phase while samples from 25oC have shown stagnation probably due to the late reaction of the bacteria cells caused by the suboptimal temperature. The cultures however set on 50oC temperature has shown growth failure probably because of the denatuation of proteins in the cultured cells inhibiting growth and multiplication. The death phase is inconclusive on this experiment mainly because the observation time is not long enough to reach such stage.
On the concern of measurement and recording, few and minor fluctuations can be seen on the resulting graphs of this experiment which can only be attributed on minor errors and methodology failure. Though these issues are irrelevant to result on inconclusive data, several rooms for improvement such as more accurate reading and longer observation period are still available for further experimentation on this subject on the future.
Works Cited:
Nguyen, Minh Thanh. The effect of temperature on the growth of the bacteria Escherichia coli DH5?. Saint Martin’s University Biology Journal. http://homepages.stmartin.edu/fac_staff/molney/website/SMU%20Bio%20Journal/Nguyen%202006.pdf. (October 14, 2012).
Smith, H.L. Bacterial Growth. Department of Mathematics and Statistics, Arizona State University. http://math.la.asu.edu/~halsmith/bacteriagrow.pdf. (October 14, 2012).
Shehata, T. Effect of Nutrient Concentration on the Growth of Escherichia coli. Journal of Bacteriologi. http://www.ncbi.nlm.nih.gov/pmc/articles/PMC246906/pdf/jbacter00368-0228.pdf. (October 14, 2012).

Stuck with your Lab Report?
Get in touch with one of our experts for instant help!
Tags:

Time is precious
don’t waste it!
writing help!


Plagiarism-free
guarantee

Privacy
guarantee

Secure
checkout

Money back
guarantee

